Navigation
Depending on what role(s) a particular admin user have, different actions/menu items will be available.
User Roles
Support for assigning roles to an administration user were added as of release 2022.2.0. Assigning different users different roles will enable/disable certain actions in the UI.
The available roles an administration user can have are listed in the table below together with what actions such user normally can perform.
| Role Name | Parent Role | Description | ||
|---|---|---|---|---|
Job Data Viewer |
Can view job data, job-services and job statistics |
|||
Job Data Editor |
Job Data Viewer |
Can delete, resend, resolve jobs. |
||
Service Editor |
Edit service settings etc. |
|||
App Event Viewer |
View Application Events |
|||
App Event Editor |
App Event Viewer |
Can delete app events |
||
Job Queue Viewer |
Can view job queues |
|||
Job Queue Editor |
Job Queue Viewer |
Can edit job queue settings such as thread count. |
||
Instance Viewer |
Can view:
|
|||
Instance Editor |
Instance Viewer |
Can:
|
||
Scheduled Job Viewer |
Can view the scheduled jobs and the status/logs from them |
|||
Scheduled Job Editor |
Scheduled Job Viewer |
Can:
|
||
Configuration Viewer |
Can view integration configurations |
|||
Configuration Editor |
Configuration Viewer |
Can edit integration configurations |
||
Service Activator Viewer |
Can view the service activators |
|||
Service Activator Editor |
Service Activator Viewer |
Can Start/Stop a service activator |
||
User Viewer |
Can view the admin users in the system |
|||
User Editor |
User Viewer |
Can create and edit users.
|
Login
To access Admin UI, you are required to login with a valid administrator user name and password.
Dashboard
Once logged in you will reach the dashboard. It shows an overview of recent activities in TIF.
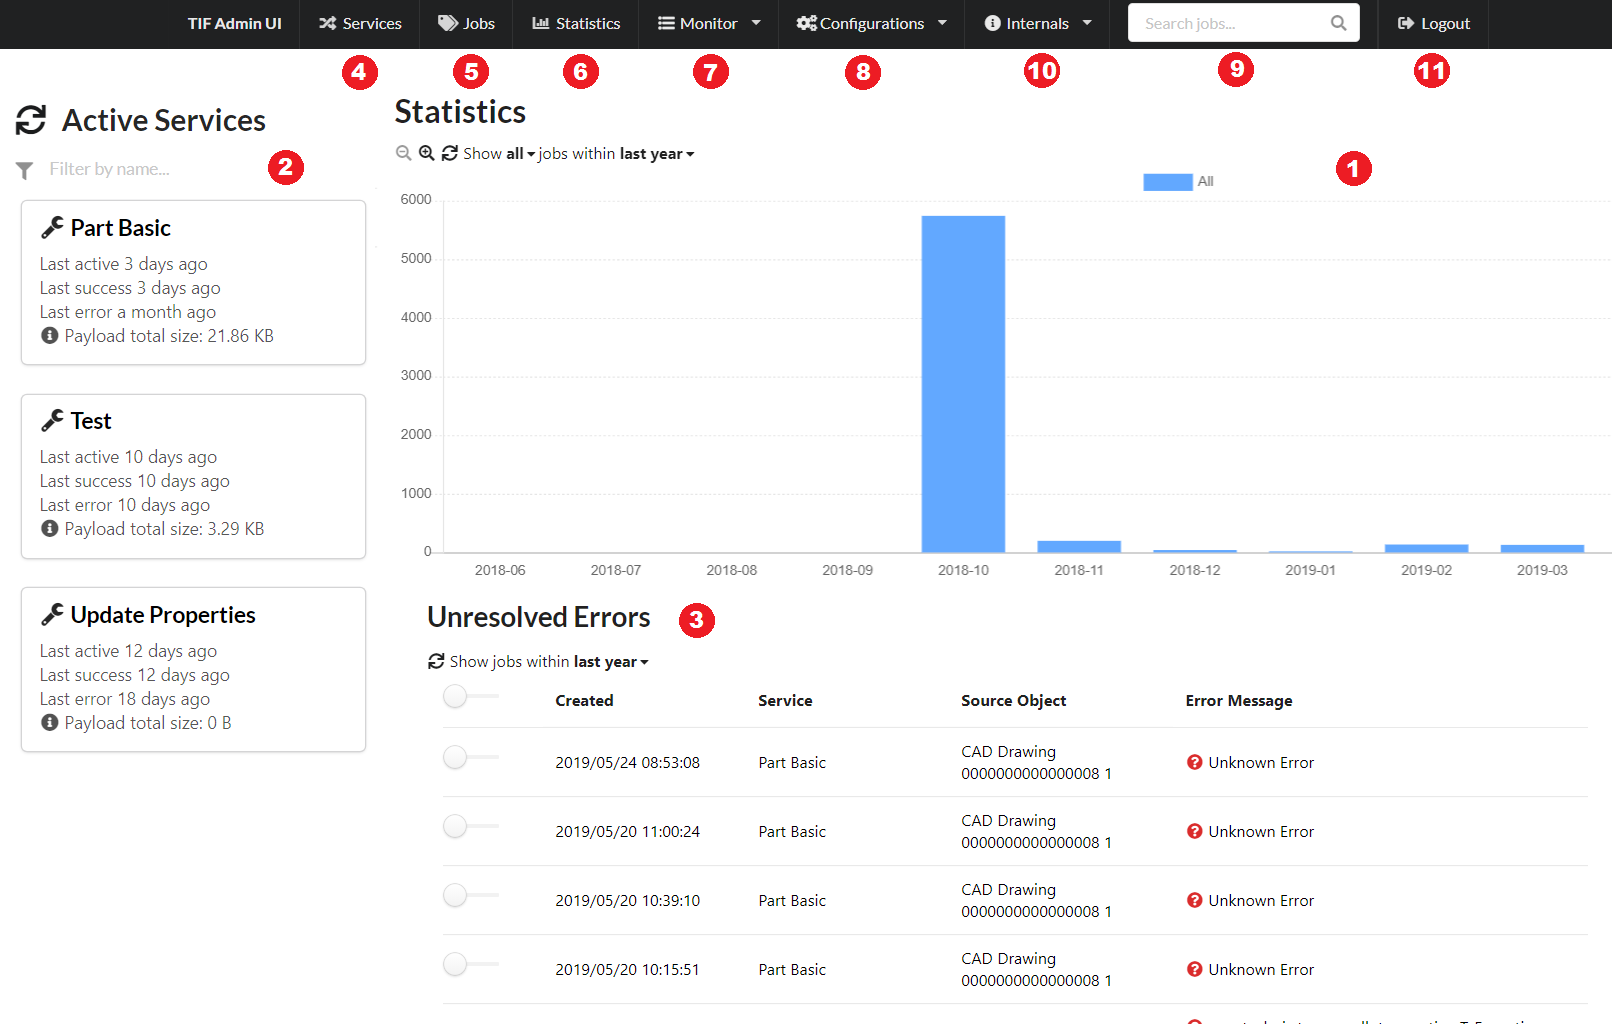
You can do the following:
-
See throughput statistics across all services
-
See list of recently active services on the TIF server
-
See most recent jobs that have failed.
-
Global search enabled if a Search Indexer has been configured.
-
TIF Internals, such as indexer/query settings, see version and license details etc.
-
Log Out
Services
TIF supports different types of services: inbound and outbound integrations, batch jobs and web services. In the Admin UI they are displayed together with the common name "Service".
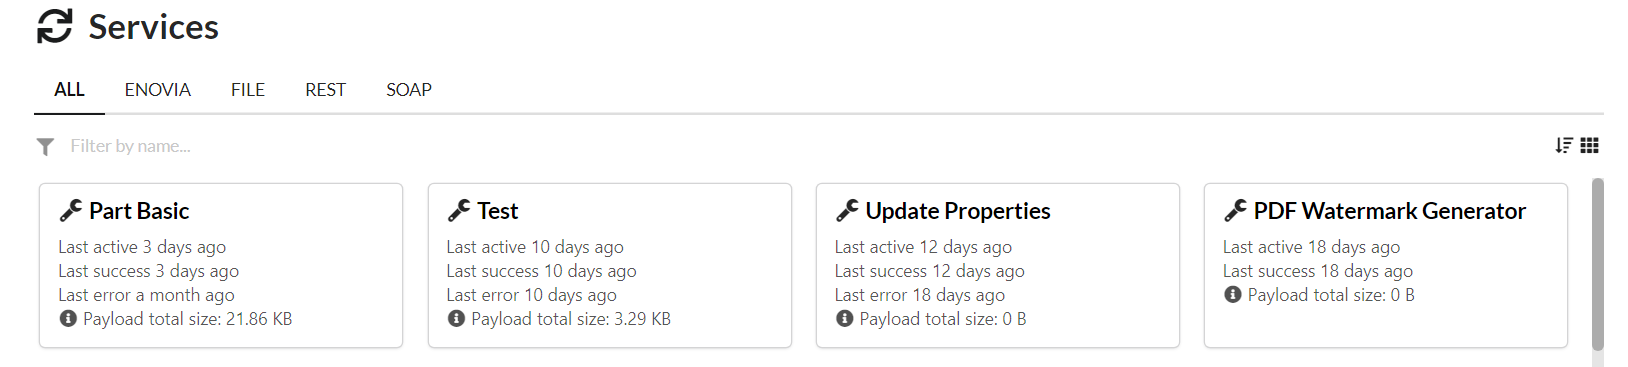
In the services view, it is possible to list services grouped by their type. In addition, the list may be shown as tiles or as a list, filter services by name and sorted by different criterias.
|
As of TIF 2017.2.0, service type MESSAGING is deprecated. Instead, new services in this category appear in Admin UI with more specific type such as AMQP, JMS and MQ. However, existing MESSAGING services registered in TIF’s DB are still visible with legacy type MESSAGING in Admin UI. |
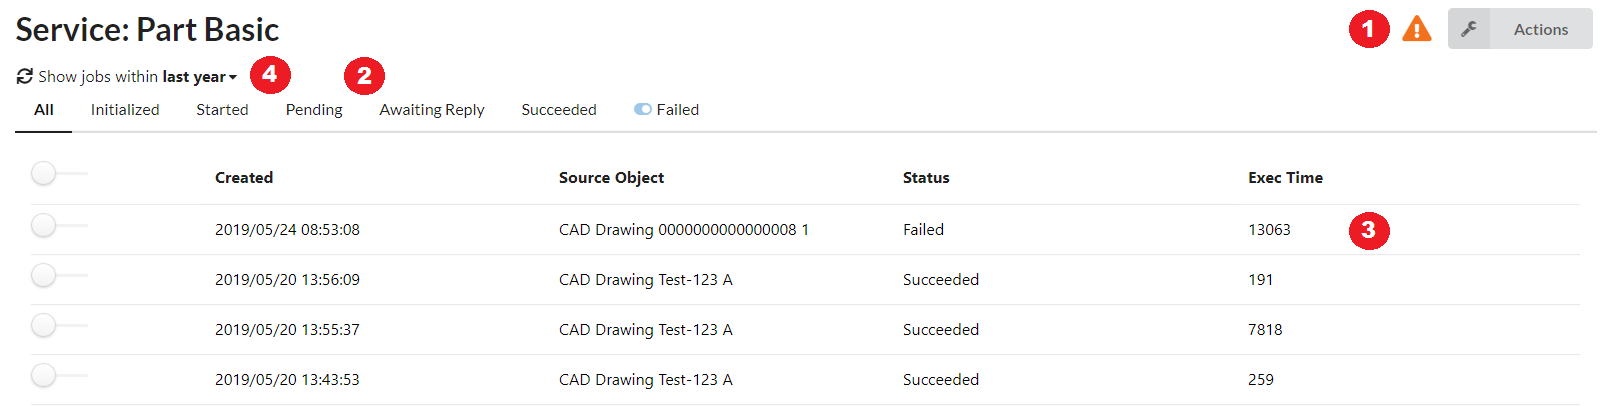
View Service
In Service view you find information specific for that service. For instance you find throughput statistic and a list of jobs for the service. The view also contains a chart that displays filtered jobs as graphical columns. There are unit and zoom selections available for the chart.
-
From Action menu you can view service settings, create, delete and export (CSV, PDF) jobs. If the service is of type ENOVIA/3DEXPERIENCE, you may also resend one or more jobs that are completed with errors. A warning triangle is shown on left to actions menu if there are some important messages regarding the service. You can click the icon to see messages.
-
Jobs are filtered by status which can be selected using buttons in the view.
-
Job View shows details of job. Press row on the table.
-
Table contents can be refreshed and filtered by date. When changing the date, table can be reloaded from the refresh icon that appears on orange color.
The information displayed for each job is slightly different depending on what kind of service you are looking on. For instance are the input parameters supplied by the user visible when viewing a web service, but no such information exists when viewing a message integration service.
Delete Service and Jobs
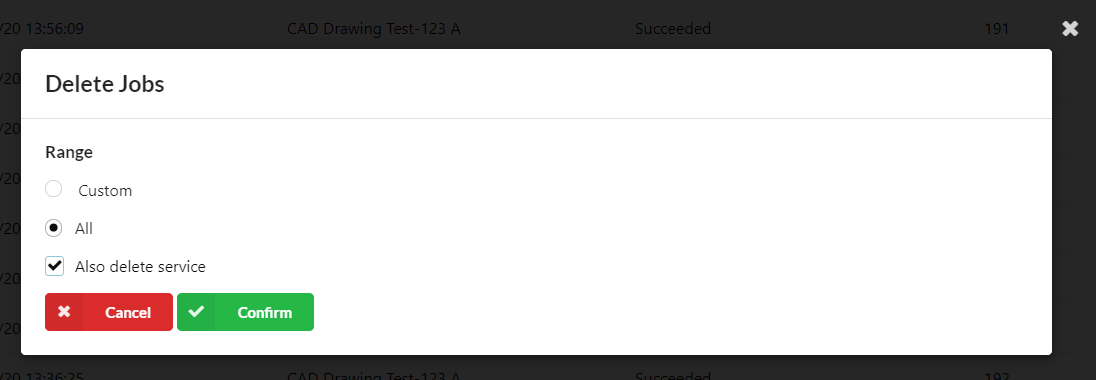
It is possible to delete jobs with custom date range or all jobs from a service. When deleting all jobs, only completed, pending or awaiting reply jobs are deleted. Jobs that are initialized or being processed are excluded.
When deleting the service, it will also delete its all jobs.
| When deleting the service, make sure it does not have jobs that are initialized or being processed as those will prevent the deletion. |
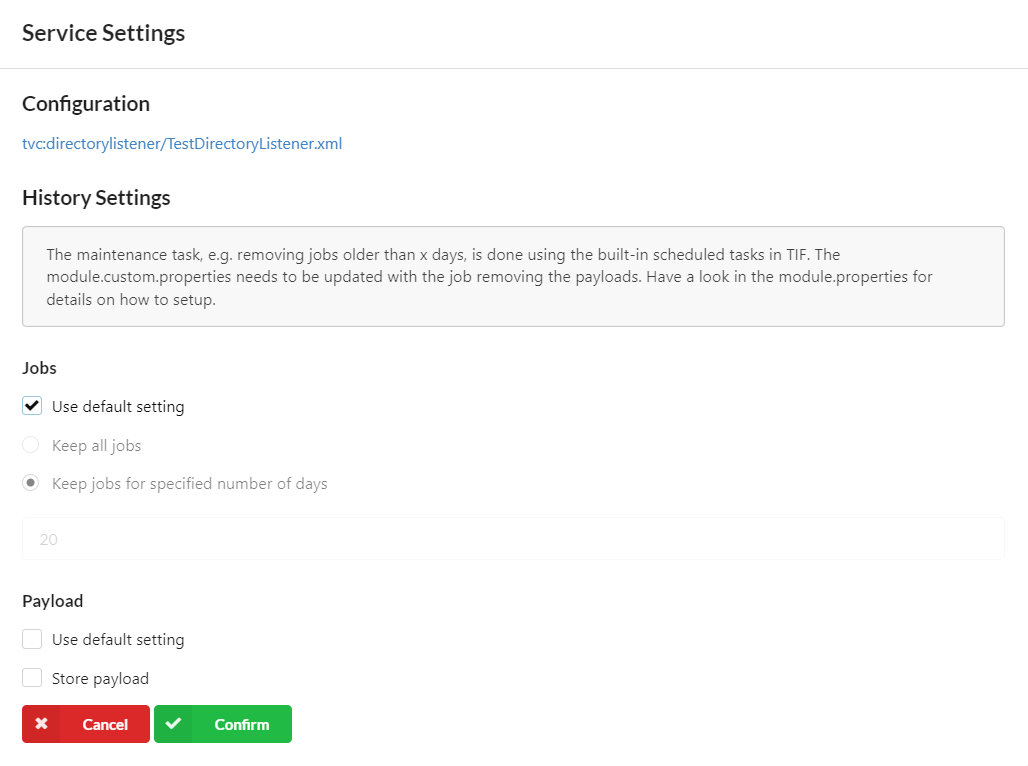
Service Settings
In Settings view you can specify the number of days to keep jobs for this service. Also it is possible to choose whether to store payload data of jobs.
Default service history settings are defined in ${TIF_ROOT}/modules/enovia/etc/module.properties.
An example of default service history settings:
# Specifies how many days jobs are kept in the TIF DB. By default jobs are kept 20 days.
defaultServiceSetting.jobKeepDays=20
# Specifies whether payloads are persisted by TIF. Default is true.
defaultServiceSetting.storePayload=true
To view current XML configuration of the service, press "View Configuration" link. See also chapter Configuration.
| It is not possible to view configurations of service of deprecated type MESSAGING. See Services. |
Jobs
Jobs view provides an overview of jobs from all services.
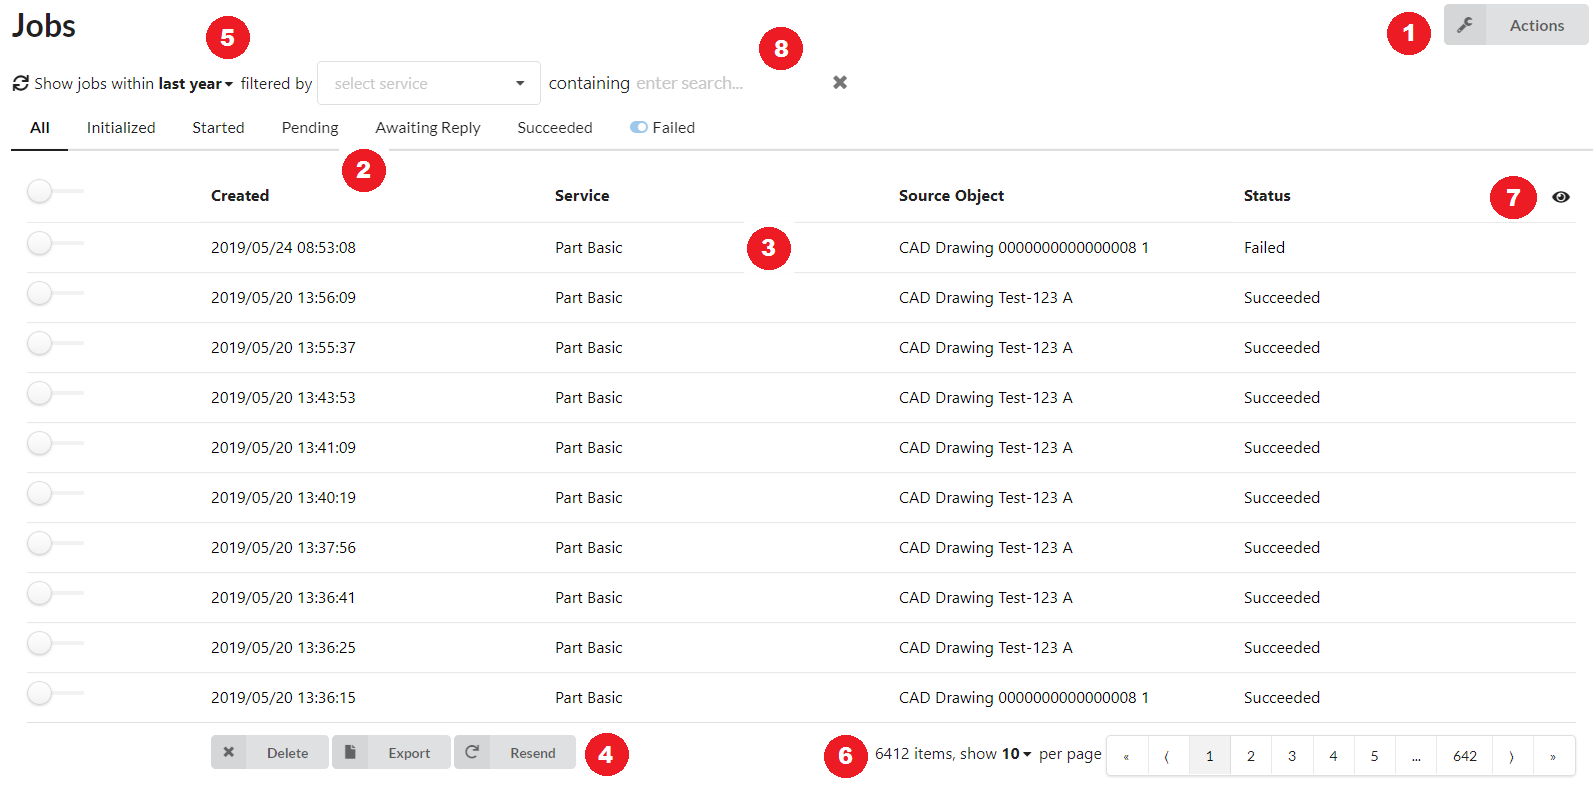
-
From Action menu you can create, delete, resend and resolve jobs.
-
Jobs are filtered by status which can be selected using buttons in the view.
-
Press table row to view a job.
-
Jobs found with the current filter can be deleted, resent or resolved (depending on the state).
-
Jobs can be filtered by date and/or service.
-
Table pagination actions.
-
Access table column visibility settings.
-
Search jobs.
Table column order can be changed by dragging column headers.
| Table column order and visibility settings are stored in browser’s local storage. If the storage is cleared, the settings are also reset. |
View Job
All details regarding the job is found on the Job view. What information that is displayed is dependent on what kind of service the job is. For message integrations you can for instance see the payload and destinations.
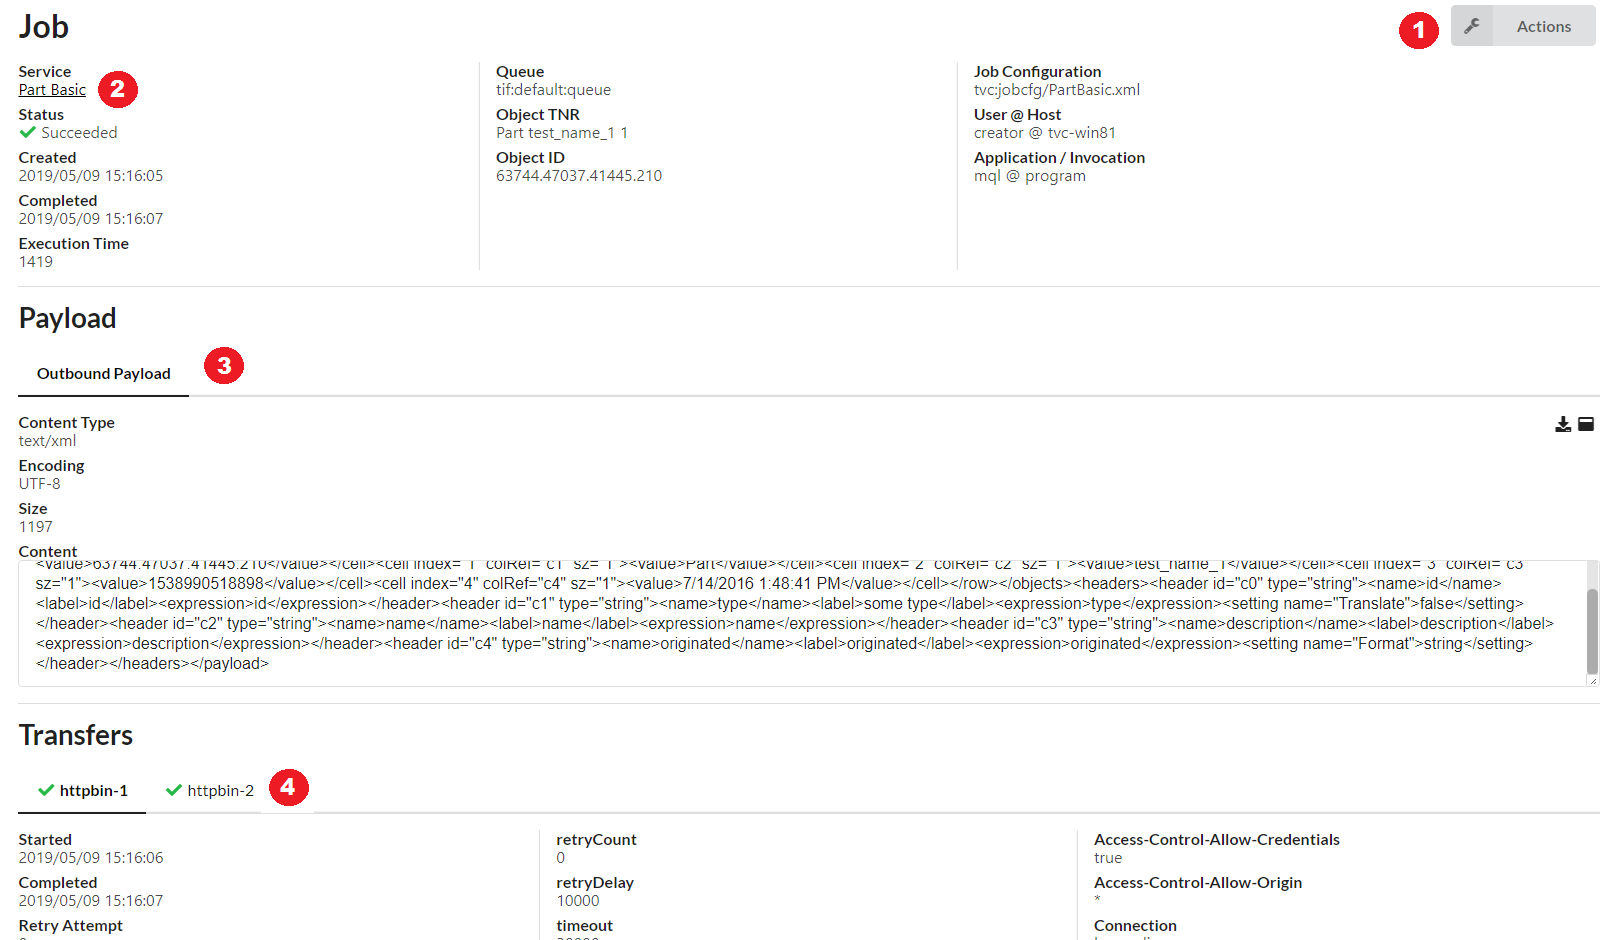
-
From Job Actions you can manage job.
-
Service View is accessed from service link.
-
Outbound and/or inbound payloads can be viewed from Payloads section.
-
For outbound jobs, transfers section displays transfer statuses for each destination.
View payload
The admin UI will only display payload having certain content-types. Moreover, payloads having a size larger than a certain threshold should never be displayed in the admin UI.
In addition, you can now also download the payload data from the TIF admin UI to your local computer.
These settings are defined within the ${TIF_HOME}/modules/enovia/etc/module.properties file and the particular settings
controlling these behaviors are:
adminui.payload.sizeThresholdForDisplay=5KB
adminui.payload.displayableContentTypes=application/xml,text/xml,text/plain,text/csv,application/json
adminui.payload.allowDownload=true- adminui.payload.sizeThresholdForDisplay
-
If unit is omitted, bytes is the assumed size. Note that if set to a negative value, the size limitation is disabled. Allowed units are: b, bytes, k, kb, ki, kib, m, mb, mi, mib, g, gb, gi, gib.
- adminui.payload.displayableContentTypes
-
Comma separated list of allowed content types.
- adminui.payload.allowDownload
-
Whether or not to allow downloading the payload from the admin UI.
Job Actions
Depending on service type, there are one or more actions available to manage jobs.
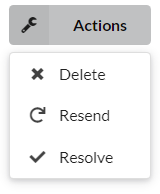
-
For outbound integrations it is possible to resend a job that is of type ENOVIA/3DEXPERIENCE. This will create a new job, process it and transfers it to all destinations.
-
Job and its information may be deleted.
-
In case job is completed with errors, you may either Resolve or unresolve it.
There are some restrictions for the resend action:
-
The resend action is only available for outbound jobs of type ENOVIA/3DEXPERIENCE. Other types of jobs are filtered out by the action.
-
If your TIF server uses an external database that is shared by multiple server instances, you cannot resend jobs by choosing a date range.
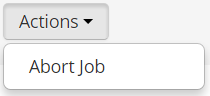
Abort Job
If job is awaiting reply, it can be aborted. This is useful in case of reply is never received. Aborting means job will be completed with error and message "Job aborted by admin".
Resolve Job
When a job is completed with errors, it might be useful to indicate when an administrator has taken care of it and error is resolved.
Once resolved, the job it is not visible in the list of errors in Dashboard. Also in Service View and in Jobs view jobs can be filtered by resolve status.
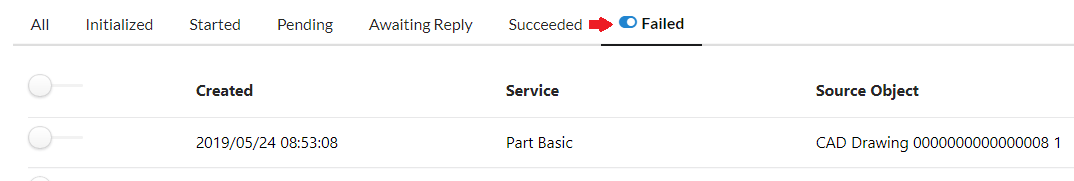
-
It is possible to view only those jobs are unresolved by clicking on the toggle button.
Create Job
Usually jobs are triggered from the ENOVIA/3DEXPERIENCE application, but it is also possible to create jobs manually from Admin UI. This is available in action menu of Jobs.
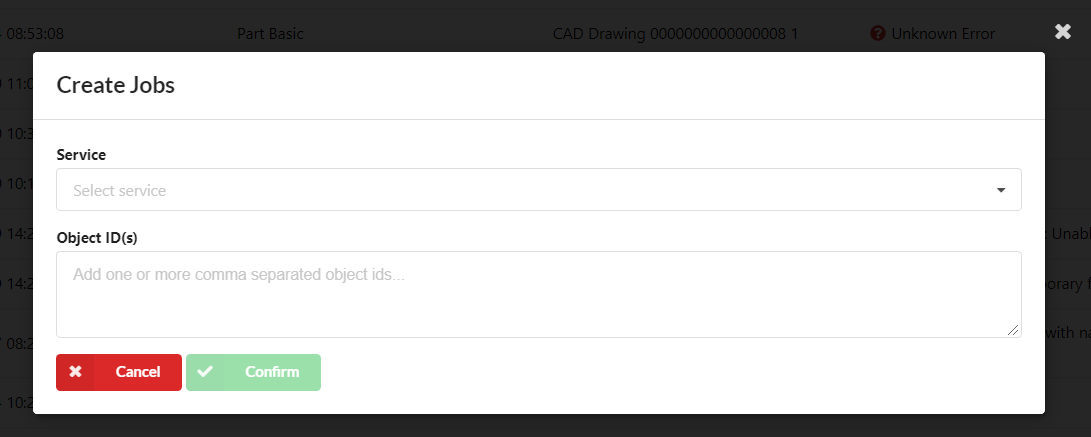
-
Select what service to create jobs
-
Provide object ids. Multiple object ids are separated with commas (,). If no object id is provided, a confirmation dialog is displayed to verify the job is created without object id.
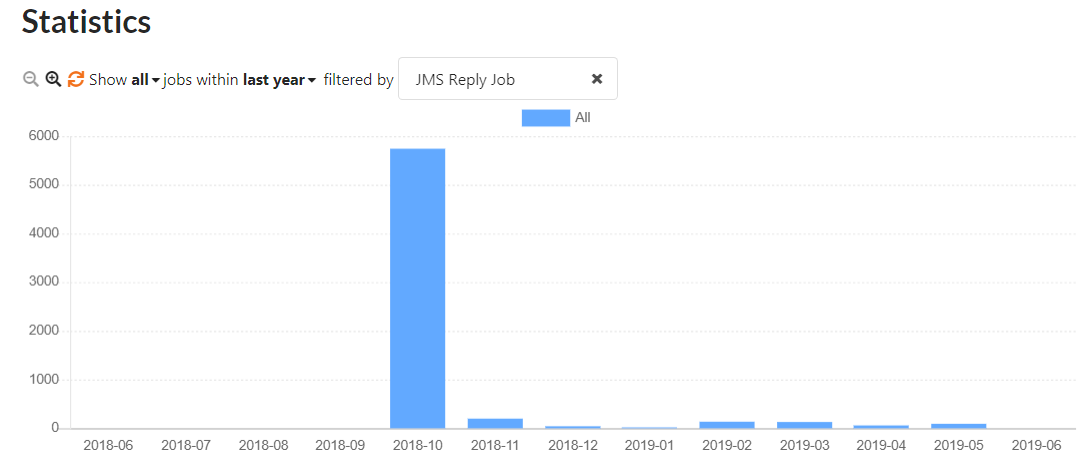
Statistics
In Statistics you can see a chart that displays job counts with selected criterias. You may include jobs from all or only from selected services.
When criteria is changed, the reload icon turns into orange to indicate reload is needed. Press the icon to apply changes and reload the statistics. You may also press the icon whenever to reload statistics.
Zoom buttons is used to adjust the time interval of the chart.
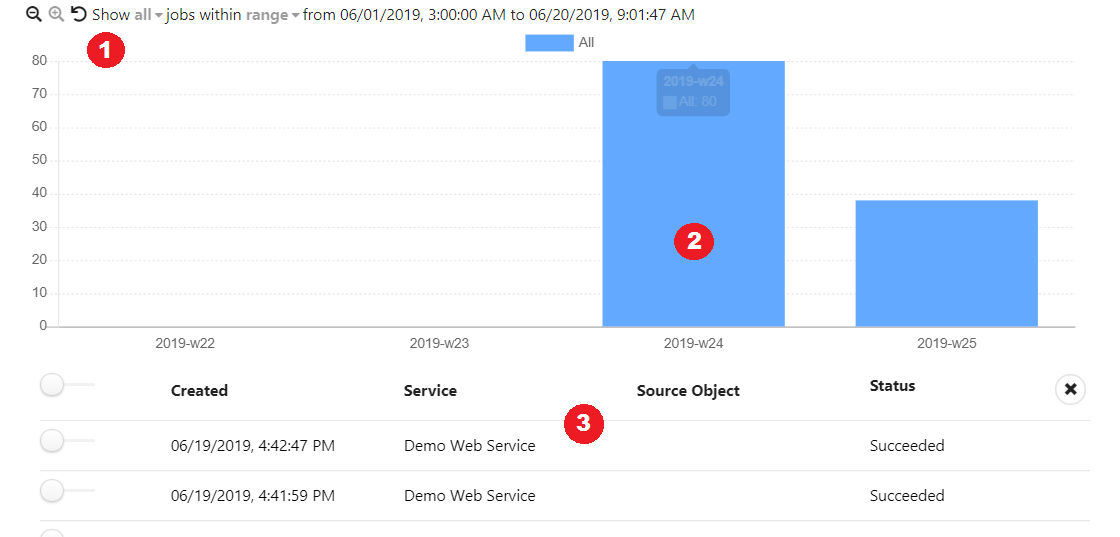
You may also drill down into statistics by clicking on bar elements in the chart. Drill-down changes the date range of statistics according to the selection and opens a table containing jobs of the selected range.
| When drill-down is active, selected criteria cannot be changed. You may reset the filter by clicking on the reset icon. |
-
Filter reset icon
-
A chart bar that can be clicked
-
Table displaying jobs that matches with drill-down range
Monitor
In Monitor view administrator can see Applications Events, monitor resources and start or stop service activators.
Application Events
In this view you can browse application events.
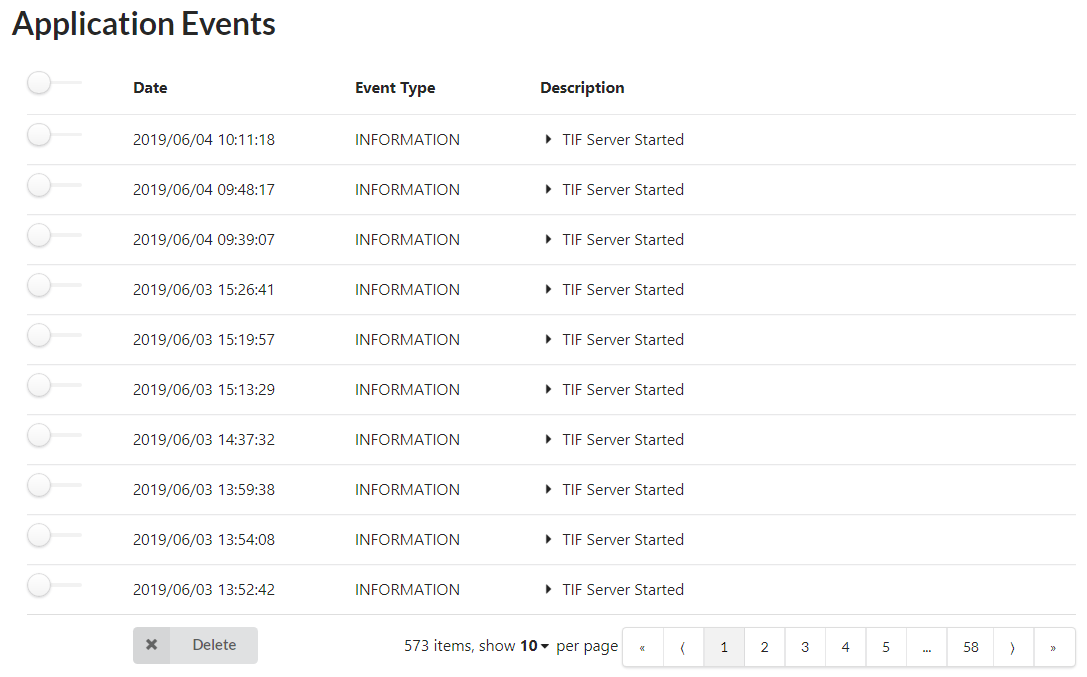
The following can be done:
-
Applications Event details by clicking on table row.
-
Delete event from the list.
-
Delete all events.
Job Queues
This view displays an overview of Queue objects located in the ENOVIA/3DEXPERIENCE database.
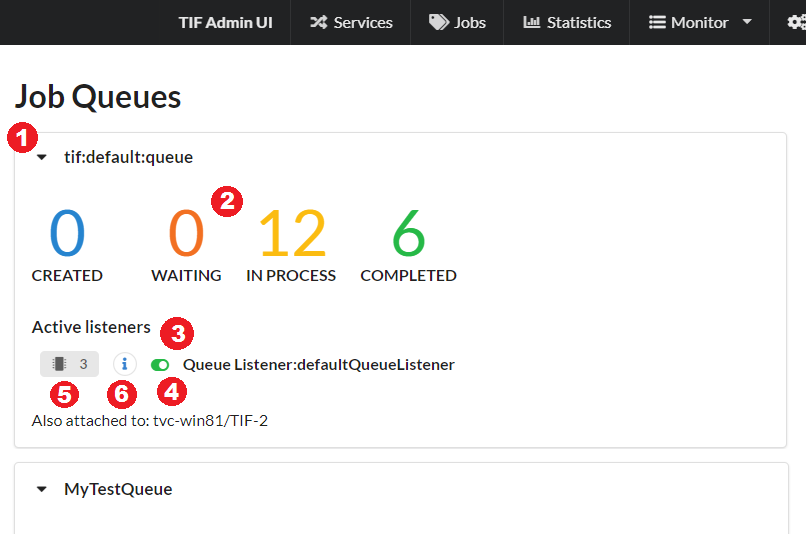
The view contains:
-
An icon to expand and view queue statistics and details.
-
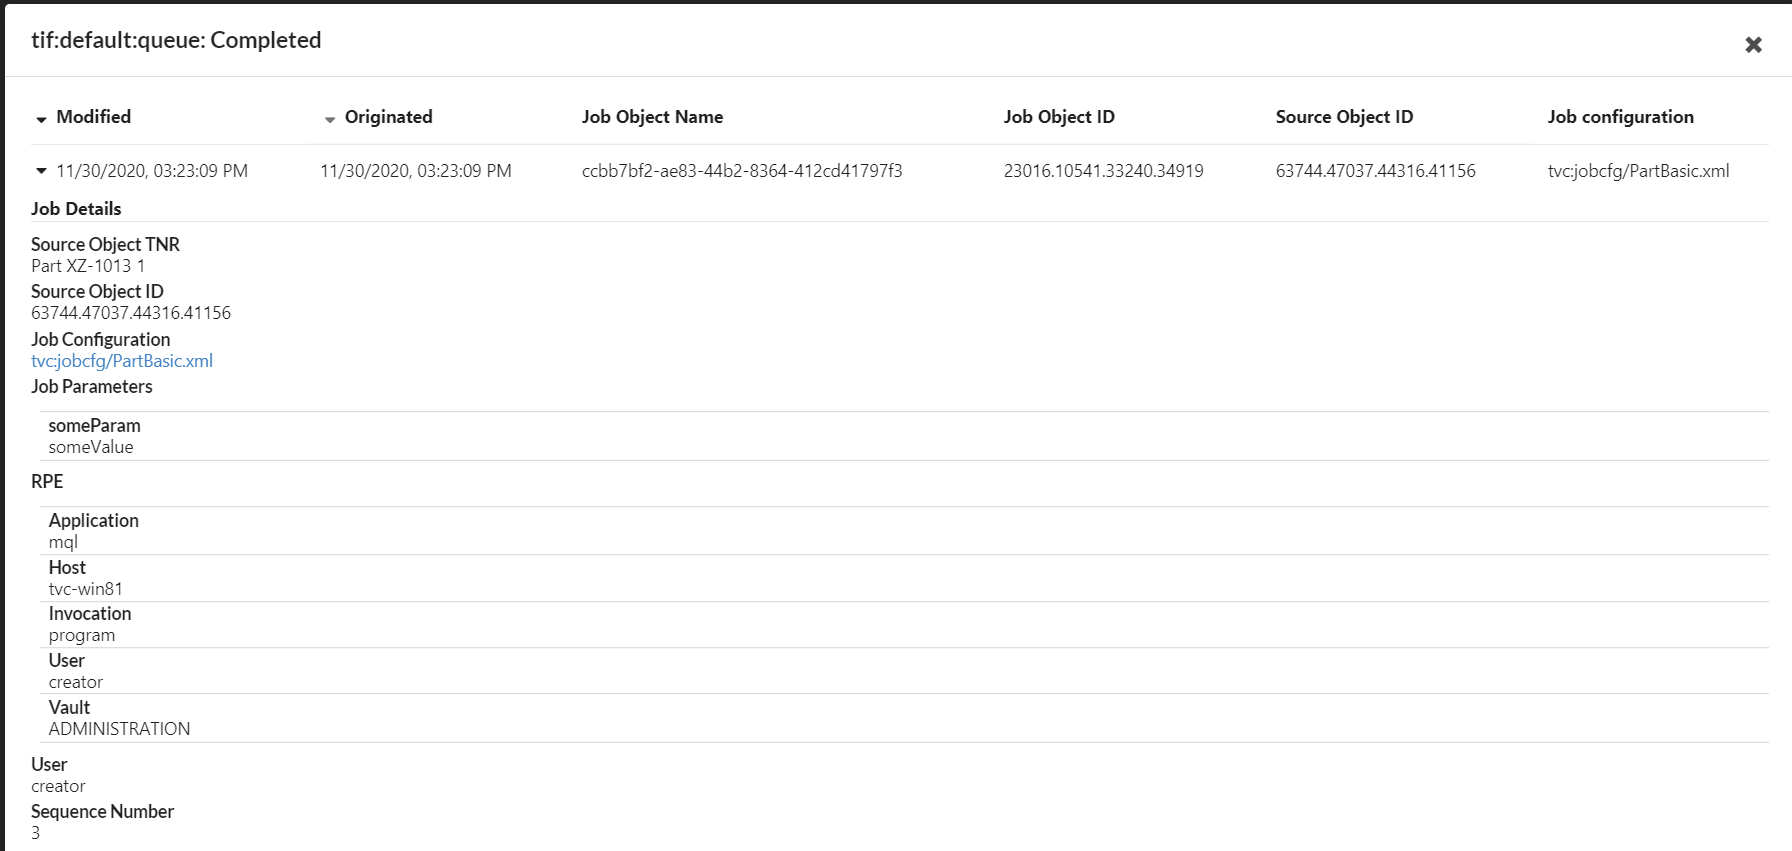
Statistics that are grouped by job object state. A statistic number can be clicked to view jobs in the particular state.
-
Active listeners are displayed below statistics.
-
A listener can be started/stopped from the toggle icon.
-
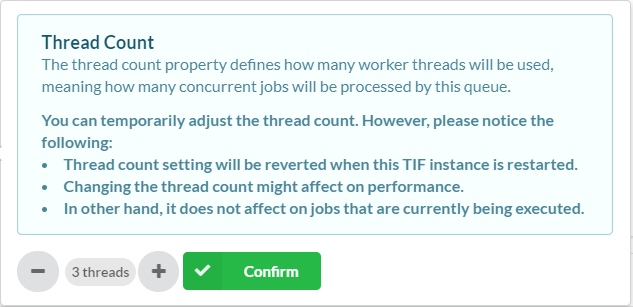
Thread count of a listener can be adjusted.
-
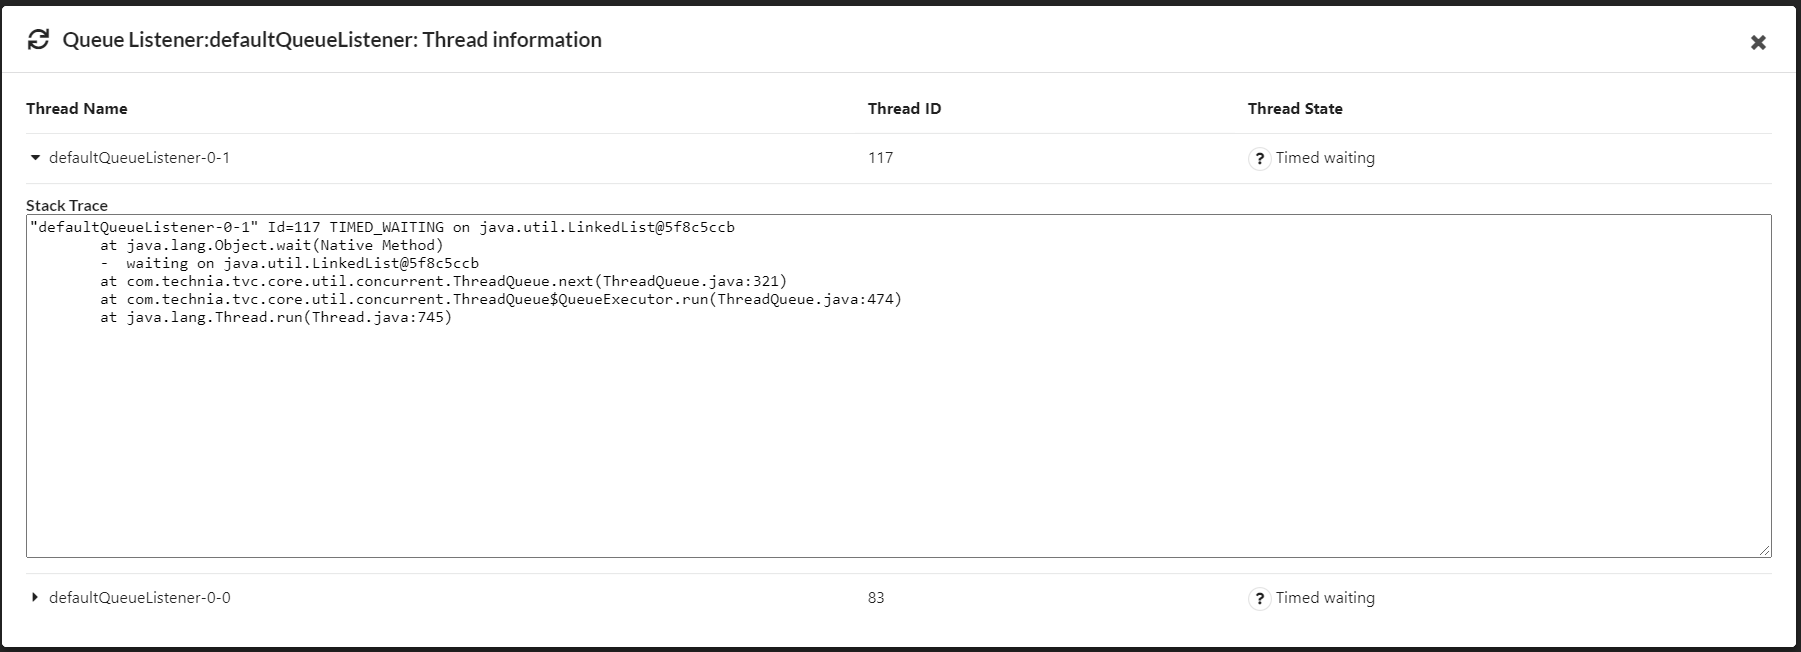
Access thread information.
Thread count setting
In the popup, you may adjust the thread count value. In practice, the queue listener is assigned with the value and restarted if needed. This does not affect on jobs that are already being executed.
Job details
Jobs in a particular state can be viewed by clicking on a statistic number. The view displays job and source object information and job configuration. Each row in the table can be expanded to view details such as RPE and job parameters.
Thread information
Thread information view provides detailed information about queue listener by showing associated threads and their states. The information includes thread id, state and stack trace.
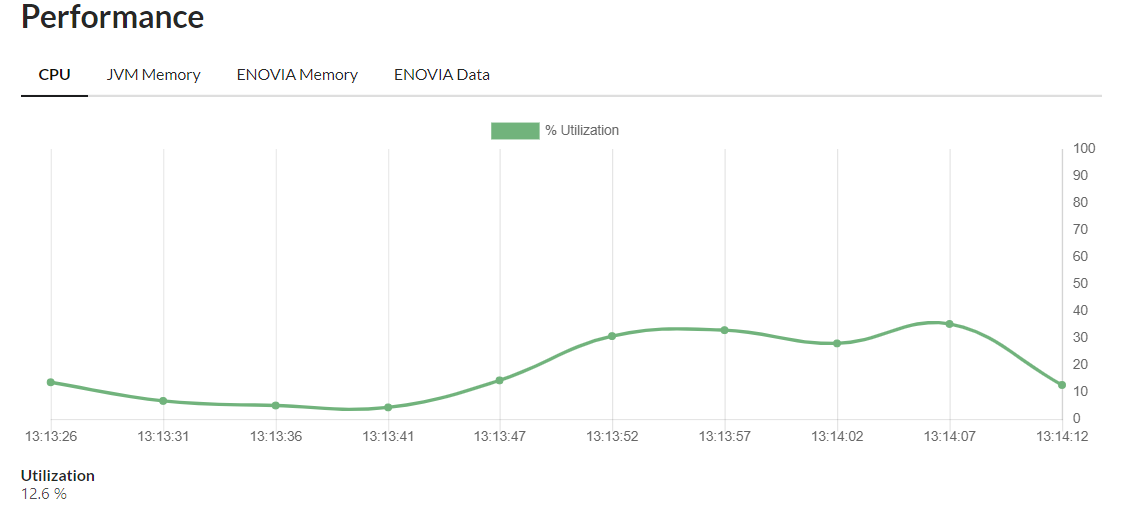
Resource Monitor
Resource monitor displays graphical presentation of recent resource consumption. Charts include CPU, JVM heap and ENOVIA/3DEXPERIENCE memory usage. In addition, it is possible to configure one or more file system locations of which disk space is monitored.
Also see chapter Monitor configuration to learn how to enable disk space monitoring and/or change update interval of charts.
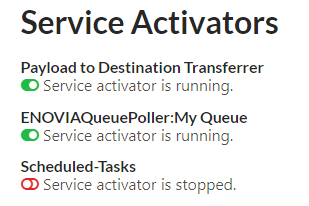
Service Activators
In this view you can see service activators.
To start or stop an activator, press toggle button that is shown on left of activator name.
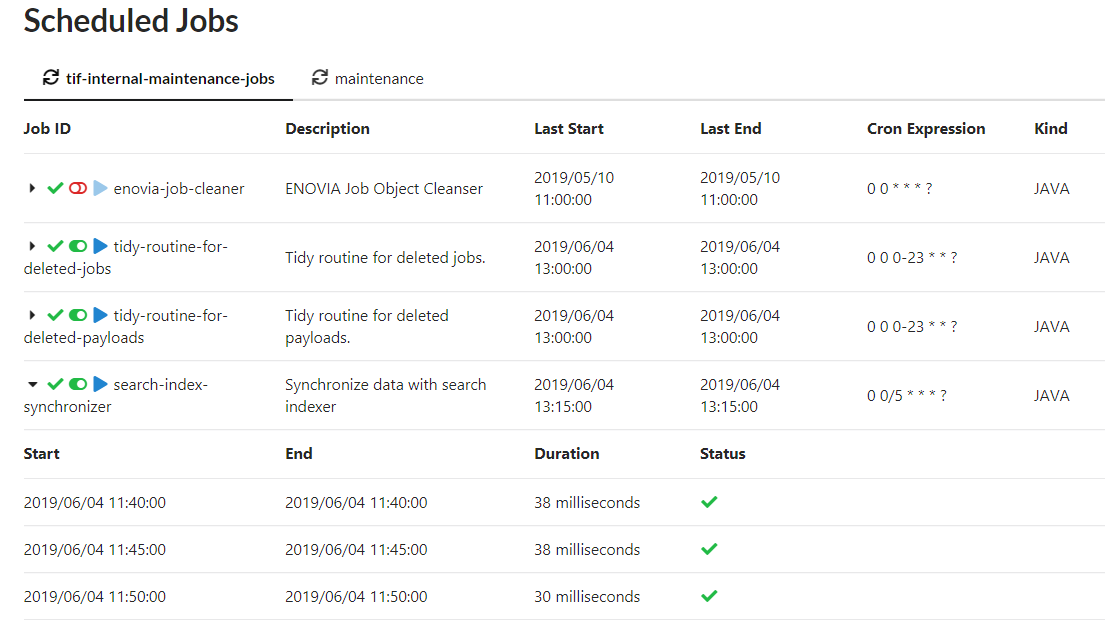
Scheduler Jobs/Logs
This view will show the currently configured jobs being managed by the scheduler in TIF.
You will from this view be able to view the history from the last executions of a job including inactivate / activate jobs and trigger a new execution of a job.
You can maximum view the last 20 executions of a particular job.
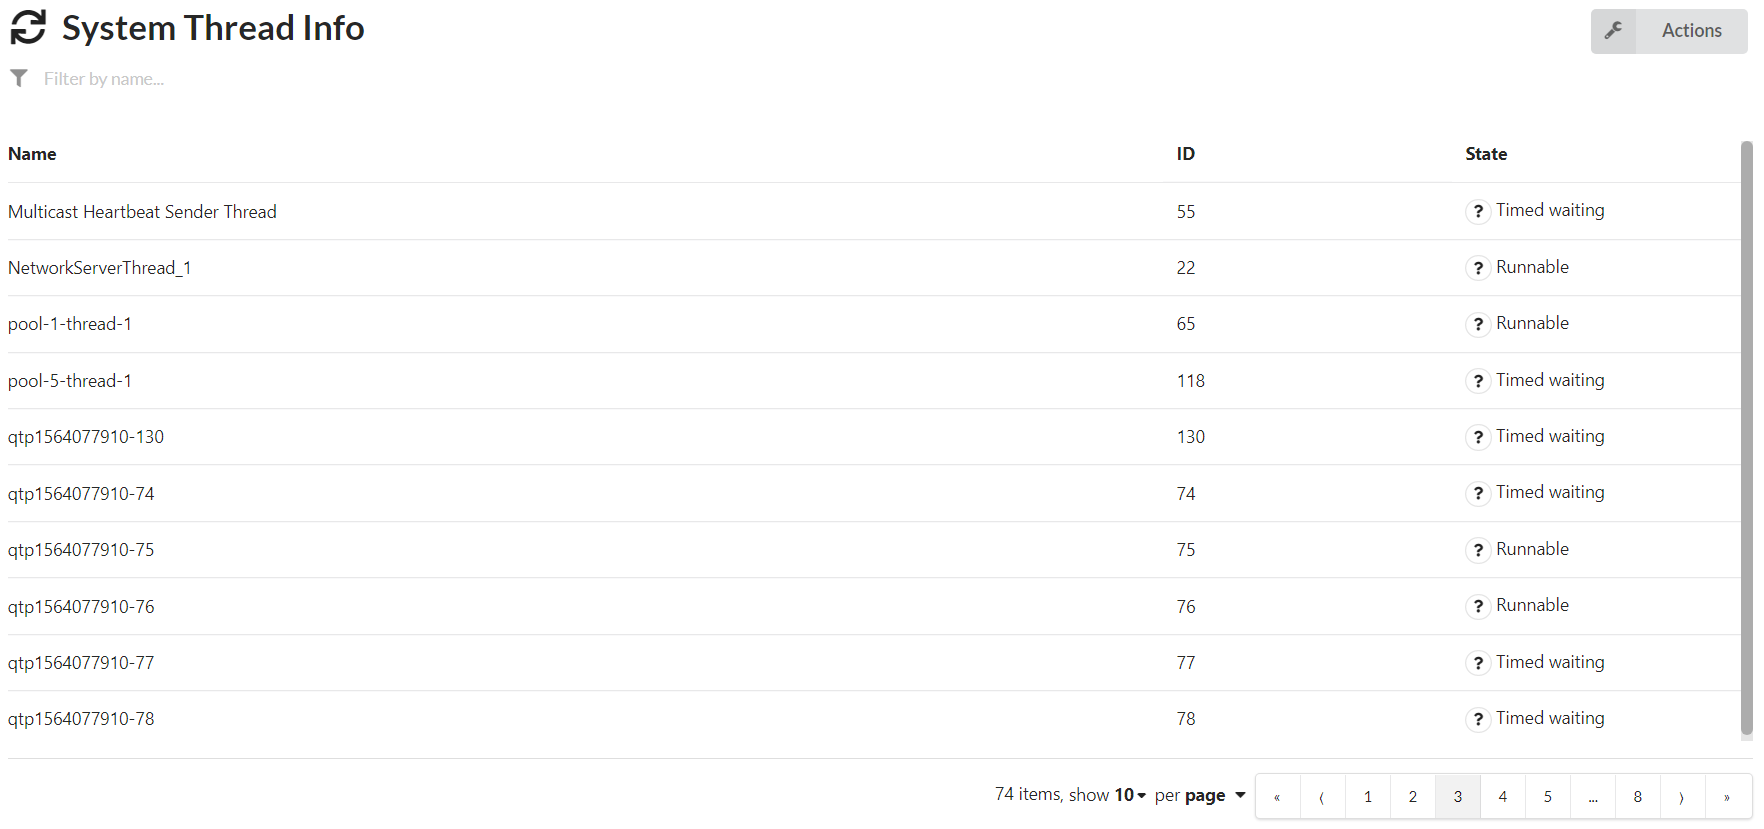
System Thread Information
This view contains information about system threads. It can be used as an error monitoring tool.
Clicking a table row displays detailed information such as thread state and thread dump.
Thread dump can be also downloaded as a plain text file from Actions → Export.
User Administration
User administration is reached from the "Internals→User Management" menu item:
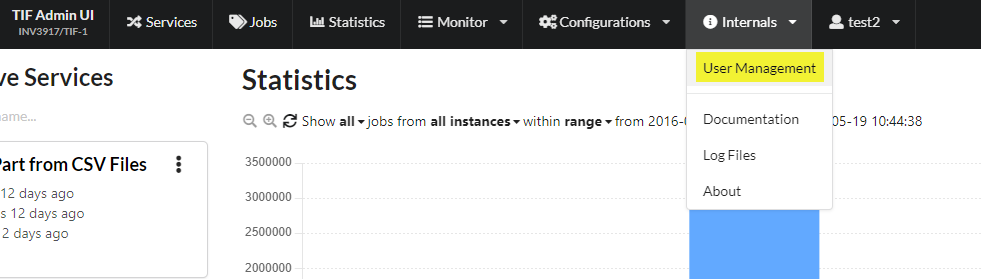
This will show a list of all administration users like below:
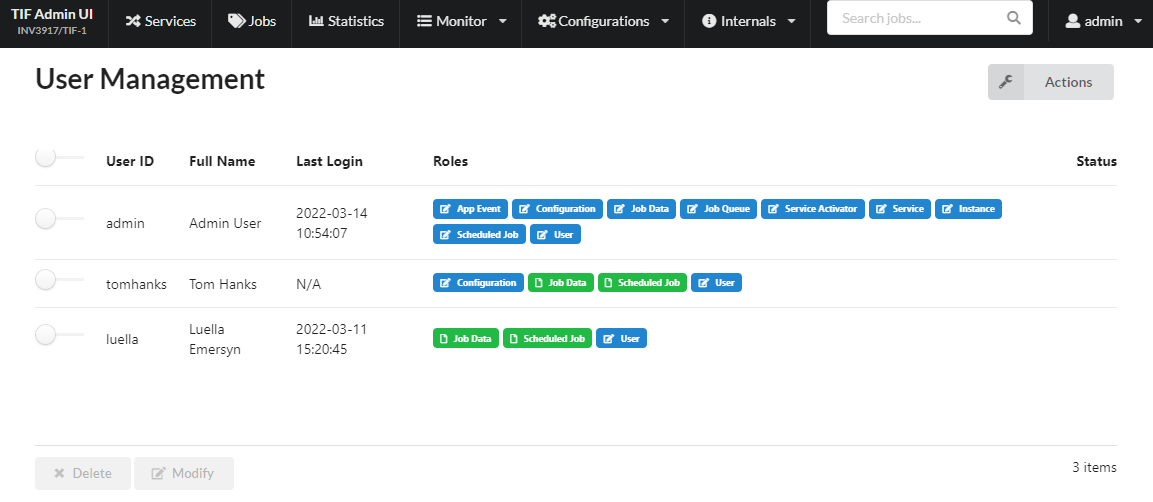
The roles are shown with different colors, where Blue color indicates both "View" and "Edit" access while Green color indicates "View" access only.
Edit or create a user uses the same dialog:
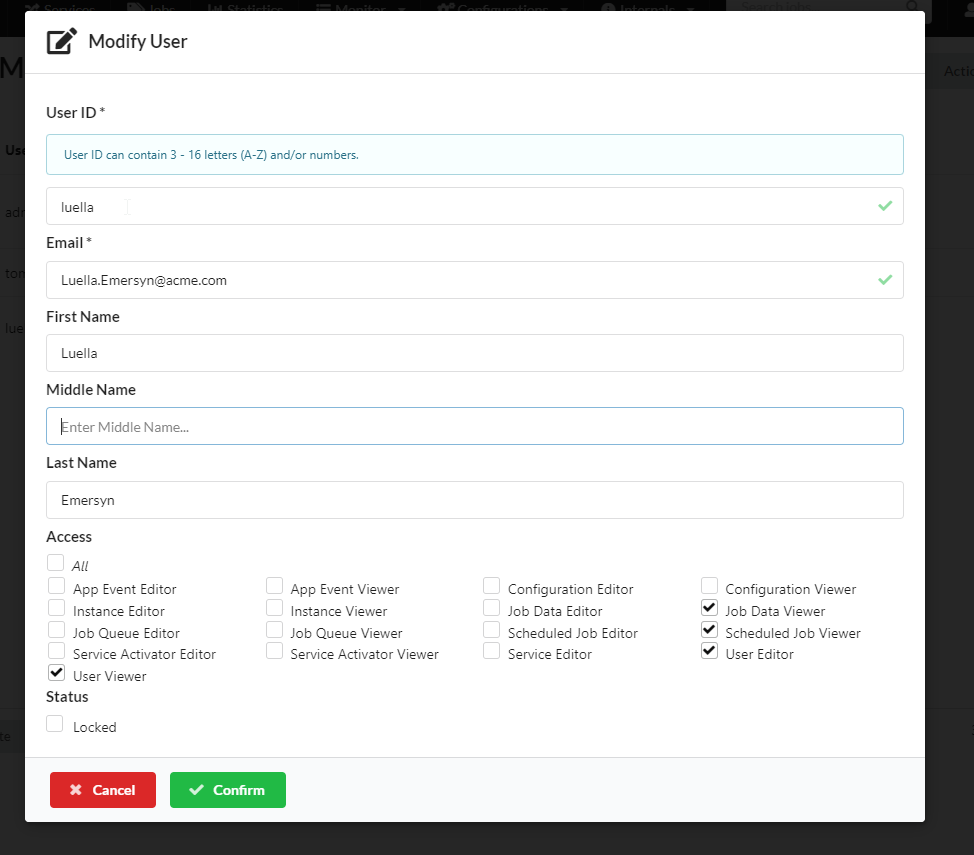
Note that the user that creates or edits a user, can not assign the other user a role that the current user is not assigned (except the Job Data View role).