Graphic Reporting - Administration Guide : Usage Scenarios
30 March 2016
1. Usage Scenarios
This section describes some common usage scenarios for the Graphic Reporting component.
1.1. Gantt Chart
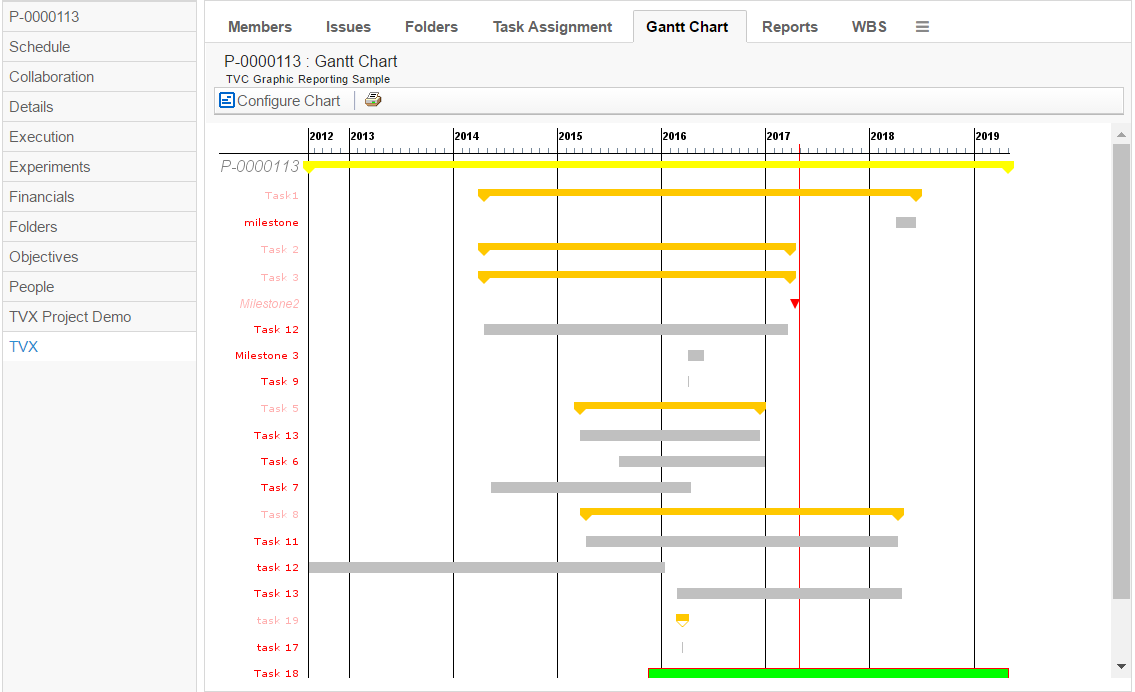
The Gantt chart is used to visualize Project Work Breakdown Structures using the common Gantt notation. Launch the Gantt chart from a Project’s, Program’s, Business goal’s or a Collection’s category menu or as a channel on a portal page.
Figure 1. Gantt chart launched from a Program tree category menu
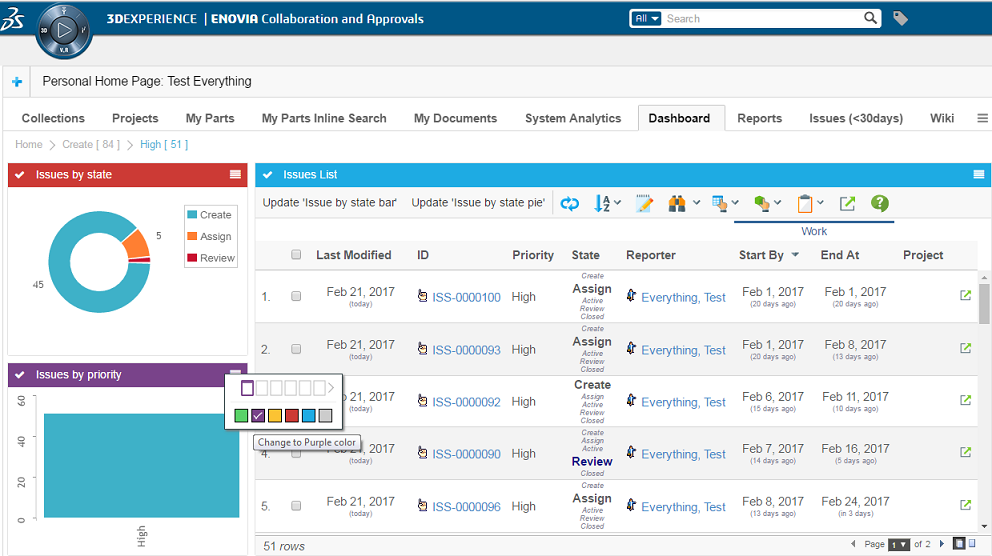
1.2. Dashboard
The dashboard user interface supports drill downs, i.e., a user can click on a link in a gadget (perhaps a slice in a pie chart or a link in a table or form) to zoom in on that data set. A user can also maximize gadgets temporarily so that they consume all available screen real estate.