<servlet>
    <servlet-name>tvcaction</servlet-name>
    <servlet-class>com.technia.tvc.core.TVCServlet</servlet-class>
    <init-param>
        <param-name>tvc.core.logLevel</param-name>
        <param-value>DEBUG</param-value>
    </init-param>
</servlet>
Troubleshooting
21 March 2016
1. Troubleshooting
1.1. Logging
TVC is using log4j as logging tool. When TVC is installed, the log-levels are typically set to ERROR for all components. The log-levels are defined by Log4j, and the possible values are:
-
OFF
-
FATAL
-
ERROR
-
INFO
-
DEBUG
The log-level should not be changed to INFO or DEBUG in a production environment, since these log-levels will generate thousands of lines, hence performance will degrade due to this.
However, if you encounter problems, you might need to change the log-level temporarily at runtime, this is described below. Also, in a test or development environment, you might find it useful to higher the log-level.
1.1.1. Defining the Log-Level
Within the deployment descriptor of your application (web.xml), you are able to define the default log level for TVC. You will first have to find the section, where the TVCServlet is defined, secondly, you need to either add an init-parameter or modify the existing init-parameters (if such are there already).
The log-level init-parameter is defined as the example below:
The init-parameter tvc.core.logLevel will define the log-level for
the entire TVC.
You have also the possibility to define individual log levels for each TVC component. An example how to do so is shown below:
<servlet>
    <servlet-name>tvcaction</servlet-name>
    <servlet-class>com.technia.tvc.core.TVCServlet</servlet-class>
    <init-param>
      <param-name>tvc.core.logLevel.com.technia.tvc.core</param-name>
      <param-value>DEBUG</param-value>
    </init-param>
    <init-param>
      <param-name>tvc.core.logLevel.com.technia.tvc.structurebrowser</param-name>
      <param-value>ERROR</param-value>
    </init-param>
</servlet>
This will turn on DEBUG logging for Core while setting the log-level to ERROR for Structure Browser.
1.1.2. Define Log-Level during Runtime
In some cases you might want to change the log-level without having to modify web.xml, and re-start the application to get the new changes applied, there is a mechanism that allows you to set the log-level during runtime.
Turning on the log level at runtime is done requesting the following URL from your browser:
http(s)://server:port/ematrix/tvc-action/setLogLevel?logLevel=DEBUG
Optionally, the parameter logDomain could be added to explicitly define a specific component (similar as for the web.xml configuration).
http(s)://server:port/ematrix/tvcaction/setLogLevel?logLevel=DEBUG&logDomain=com.technia.tvc.reportgenerator
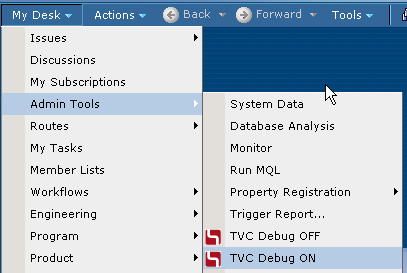
When TVC is installed into an AEF environment, a couple of convenient
commands are added to the My Desk → Admin Tools menu, which can
be used to turn on and off DEBUG logging. See screenshot below:
Change server and port and possibly the context path within the URL examples above to match your environment.
In order to be able to use the ability to set the log-level during runtime, you must be logged in as a user with any of the following access-rights:
-
A system administrator
-
A business administrator
-
A user, assigned to the AEF defined role called
Administration
Manager
If none of these requirements are satisfied, the requested URL will return the HTTP error code 403 (Forbidden).
1.1.3. Logging from Custom Code
Assuming that you have implemented your add-ons to TVC as a TVC Plugin (see this chapter for more information), you can take advantage of the logging functionality provided by TVC.
The code example below illustrates how to obtain a logger, and how to use it.
package com.mycompany.thepackage;

import com.technia.tvc.log4j.Logger;

public class MyClass {
    private static final Logger logger = Logger.getLogger(MyClass.class);

    public void someMethod() {
        if (logger.isDebugEnabled()) {
            logger.debug("About to do something...");
        }
        try {
            // do some operation
        } catch(Exception e) {
            logger.error("Unable to perform the operation, see stack trace below:", e);
        }
    }
}
1.2. Simplified Logging of Variables
Often it’s desirable to include variables in the logged message. The string needs to the be constructed. This can be done in a variety of ways. For example, String.format(), StringBuilder and pure string concatenation can be used. Ideally the string concatenation should only be done if the string actually will be written to the log files in order to improve performance. Logging statements are therefore wrapped in if statements checking if the log level is set to for instance debug.
An alternate approach is to use this signature:
void logger.debug(String format, Object... args);
The first parameter contains the format of the string to log. Use {} in the string to indicate where to insert variables. Variables are supplied as varargs. Make sure that the number of occurrences of {} matches the number of supplied variables.
This makes it possible to transform code looking like:
if (logger.isDebugEnabled()) {
    logger.debug(String.format("Using custom request-processor '%s'", requestProcessorClass));
}

if (logger.isDebugEnabled()) {
    logger.debug("Loaded pagination range from user preferences: " + range);
}
Into this code:
logger.debug("Using custom request-processor '{}'", requestProcessorClass);
logger.debug("Loaded pagination range from user preferences: {}", range);
| Equivalent methods are available for all log levels (ERROR, WARN, INFO and so on). |
1.2.1. Add User Name and IP to the Log
When the logging is turned on in an environment where several users are working, it might be hard to follow the output from the log, since the output from all users are mixed with each other.
There is a way to add the user name (Matrix user name) and IP address within each log statement. By default, this behavior is disabled, but can be turned on by setting the following init-parameter:
<servlet>
    <servlet-name>tvcaction</servlet-name>
    <servlet-class>com.technia.tvc.core.TVCServlet</servlet-class>
    <init-param>
      <param-name>tvc.core.logUser</param-name>
      <param-value>TRUE</param-value>
    </init-param>
</servlet>
When this setting is set to TRUE, the output will look like the example below:
[TVC] [pool-1-thread-11] [Test Everything - 192.168.0.165] DEBUG 10:22:31,639 .........
Hence, the output in the log could be parsed/filtered by some other tool.
1.2.2. Log Watcher
Sometimes, it is hard or impossible to find the file, which the log-output is written into due to restricted access or for some other reason. In such case, you might find it useful to use the Log Watcher tool that is built-in to TVC. This tool will allow you to access the generated log-statements directly through a separate browser window.
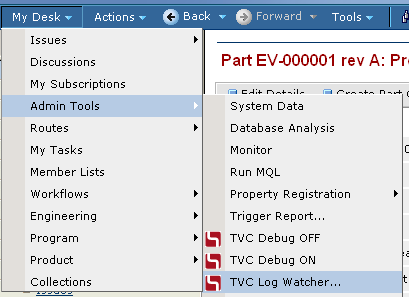
To open the Log Watcher, use the command saying TVC Log Watcher from
the menu shown below:
If you don’t have the AEF installed, or for some reason doesn’t have these commands available in the menu, you can also type in the following URL within a browser window:
http(s)://server:port/ematrix/tvc/core/tvcLogWatcher.jsp
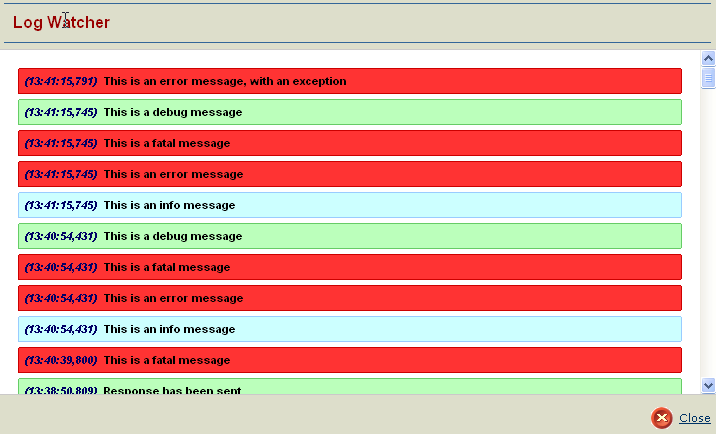
This command will open up a window, where all the log messages are shown. Each generated log message will appear to the top in the window, and you can click on each item to get detailed information about each log statement. See the examples, with some sample log messages below:
An example showing the output when an item has been expanded.
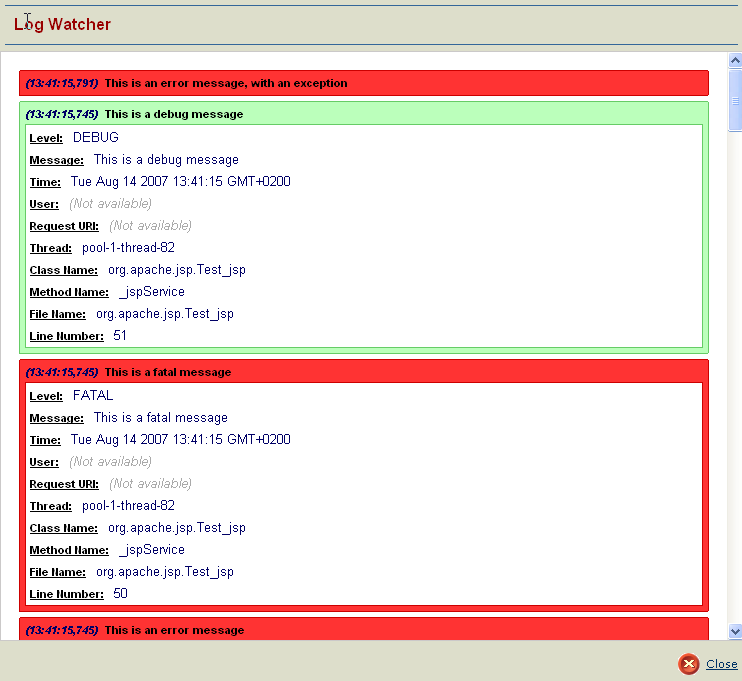
Also, an example of a log message with a supplied Exception (Stack Trace).
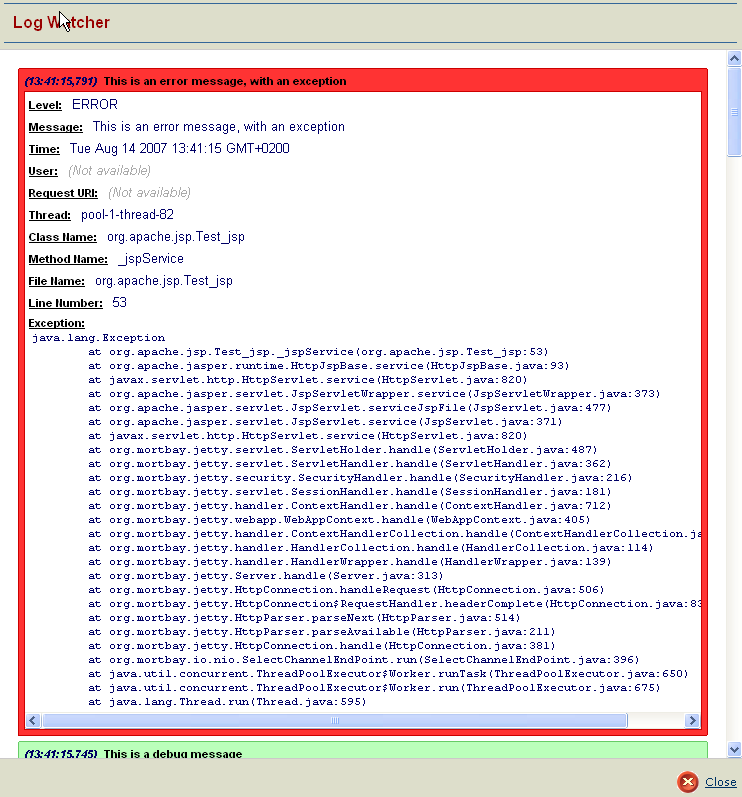
The shown messages within the log watcher window, depends on the current log level. I.e. before using it, you might need to turn on debugging, and after you close it, you should turn off the debugging output again.
1.2.3. Log Files
By default, TVC will also store the generated log output into a separate log file, in addition to in the log file, which typically all std-out messages might be re-directed into by your Application server.
The name of this log file is tvc.log, and the file is stored in a
directory named TVCLogs. Exactly where the TVCLogs directory is
located, depends highly on your application server. Typically, each
webapplication is supplied with a temp-directory by the application
server. Please consult your Application server documentation how to find
this folder.
The storage of the log output to a separate log file could be turned off, by supplying following init-parameter to the TVC Servlet.
<init-param>
    <param-name>tvc.core.logToFiles</param-name>
    <param-value>false</param-value>
</init-param>
1.3. Tracing
In some cases, you might be interested in investigating how much time a certain request takes, but also see where the most time within that particular request is used.
If so, then you could use the built-in functionality for tracing. When turning on the trace functionality, you will in the log-output be able to not only see how much time each request consumes, but also how much time individual code sections consumes.
Even though TVC has been designed to be as fast as possible, there might be situations when the performance is worse than expected. Also, there might exist bottlenecks where the root cause is not in TVC. For example, when TVC is about to invoke custom JPOs, or executing database-queries (queries, inquiries, expansions etc).
The tracing functionality can in these situations be used to find these or similar possibly bottlenecks.
1.3.1. Enabling the Trace
The trace can be enabled in two different ways.
(1) Within the deployment descriptor of your application (web.xml), you are able to turn on the tracing for TVC. You will first have to find the section, where the TVCServlet is defined, secondly, you need to either add an init-parameter or modify the existing init-parameters (if such are there already).
    <servlet>
        <servlet-name>tvcaction</servlet-name>
        <servlet-class>com.technia.tvc.core.TVCServlet</servlet-class>
        <init-param>
            <param-name>tvc.core.traceEnabled</param-name>
            <param-value>TRUE</param-value>
        </init-param>
    </servlet>
(2) In some cases you might want to turn on the tracing without having to modify web.xml, and re-start the application to get the new changes applied. There is a mechanism that allows you to toggle the trace during runtime.
This is accomplished by requesting the following URL from your browser:
http(s)://server:port/ematrix/tvc-action/toggleTrace
When TVC is installed into an AEF environment, a command is added to the
My Desk → Admin Tools menu, which can be used to toggle the
trace. See screenshot below:
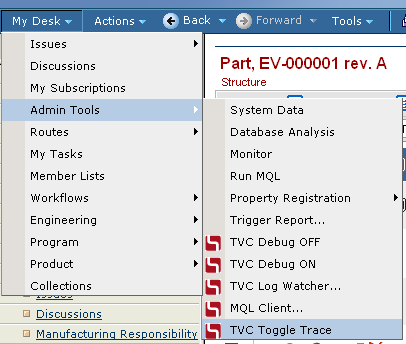
The same command or URL is used to disable the tracing.
| Be careful when using tracing in a production environment, since this will not only fill the log files with redundant information, it will also decrease the general performance of the application. |
1.3.2. Example
This is an example of how the output might look like: (note that the output has been truncated in order to fit the page better).
    [TVC-TRACE] [pool-1-thread-139] [Test Everything - 192.168.0.165]  14:23:36,100
    Time:           235 ms - /viewTable
      Time:          62 ms - Processed forward [path=/tvc/structurebrowser/tvcTable.jsp...
      Time:         172 ms - com.technia.tvc.structurebrowser.actions.ViewTableAction
        Time:        78 ms - Evaluation [rows=11, columns=10]
          Time:      31 ms - Selected data from 11 objects:  [policy, current, current...
          Time:      47 ms - Selected data from 10 relationships:  [attribute[Find Number]...
        Time:        93 ms - Expanded node [levels=1, descendantCount=10]
          Time:      78 ms - MQLUtils.bosExecute [command=escape expand businessobject 1179...
In this case, we can see that 172 of 235ms were spent in expanding the structure (93ms) and retrieving the data for all rows/cells (78ms). The rest, 62ms, were consumed by the JSP page that renderer the user interface.
Not all parts of the code is traceable. Only those parts that normally involves database calls as well as some other parts that might consume time can be traced.
1.3.3. How to trace your own code?
You can also customize your own code, so that it could be traced too. Simply do as the example below:
import com.technia.tvc.core.Tracer;

public class MyClass {
      public void myMethod() throws SomeException {
          boolean traced = Tracer.startTrace();
          try {
              // code to be traced
          } finally {
              if (traced) {
                  Tracer.endTrace("The message to appear in the trace log...");
              }
          }
      }
}
|
When using the Tracer, you must ensure that the endTrace method is called before your method is terminating. Also, you should never call endTrace unless the trace really were started. This is important as if the startTrace/endTrace calls are unbalanced, it will generate incorrect measurements. |
1.4. Status Monitor
TVC has a built in status monitor, which could be used to trace problems related to the TVC functionality.
The status monitor is reached by requesting the following URL from your browser:
http(s)://server:port/ematrix/tvc-action/monitorStatus
The status monitor brings you information about the system you are running, and information about all the TVC components that has been installed.