curl -X POST "http://localhost:8181/enovia/adminapi/v1/auth/login" -H "Content-type: application/json" -d '{"username":"admin","password":"the-password"}'TIF Administration and Configuration Guide - ENOVIA Admin UI
04 June 2019
1. Overview
The Admin UI is bundled with the TIF product. The application is web based and can be used to monitor what currently is happening on the TIF server as well as what has happened in the past.
Default URL to the Admin UI: http://<host>:8181/enovia/adminui.
By default, the port number is 8181, but it can be configured.
The context path may also be configured.
See also this page.
|
You should change the default password. |
Admin UI is accessible on each TIF server instance.
1.1. Supported Browsers
The Admin UI is supported/tested on these (evergreen) browsers
-
Firefox
-
Chrome
-
Microsoft Edge
| The application may work on other browsers too, however, we only support the browsers listed above. |
Regarding Internet Explorer 11 (IE-11): Please consider using another browser such as any in the previous list, since this browser is very old and have poor support for newer web-technologies. If you still insist on using IE-11, you should be aware of that the Admin UI may either not work at all or only work partly. You should also know that the application will not work at all if the "Compatibility mode" is turned on.
1.2. REST API
The Admin UI application is a single page application that communicates with the TIF server via REST endpoints.
These endpoints are documented in this document.
To use the endpoints, you need to authenticate the user to obtain a token. Example:
This will return a token like this:
{
  "token" : {
    "type" : "TIFToken",
    "value" : "7ff81653-71fb-47cd-b1f7-46021896c1d2"
  }
}
For any further call, the above token should be sent in each request:
curl -X GET "http://localhost:8181/enovia/adminapi/v1/..." -H "Authorization: TIFToken 7ff81653-71fb-47cd-b1f7-46021896c1d2"NOTE:
-
If password is wrong, HTTP 401 is returned.
-
Trying to an invalid token returns HTTP 403
-
Logout will revoke the token (or after 24h inactivity)
You can disable the authorization check via a property in module.properties. This should only be used for test or during development.
adminapi.authorization.enabled=false2. Search Indexer
TIF can be integrated with a search indexer; e.g the internal data in TIF is added into an index in order to speed up queries from TIF and reduce the overall load on the TIF server.
Please read this page for details how to enable this.
Once you have configured TIF to utilize a search indexer, you will see some new things in the Admin UI. See image below:
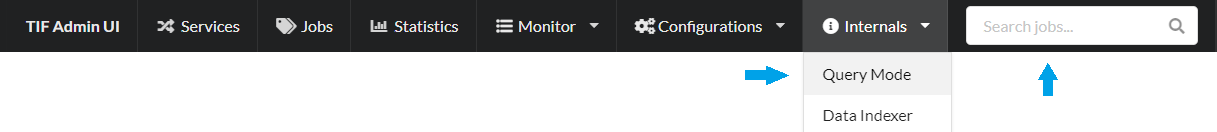
Figure 1. Search
In the top menu, you will have an input field that allows you to execute global queries against the jobs in the search index. The query is made against all data related to the job such as payload content etc.
Secondly, you will have some new functions related to indexing and searching settings.
2.1. Query Mode
The query mode is per default set to "use search engine if available". However, during some period when all data not have been added to the index yet, you may want to query the database instead.
This can be changed from the query mode settings page.
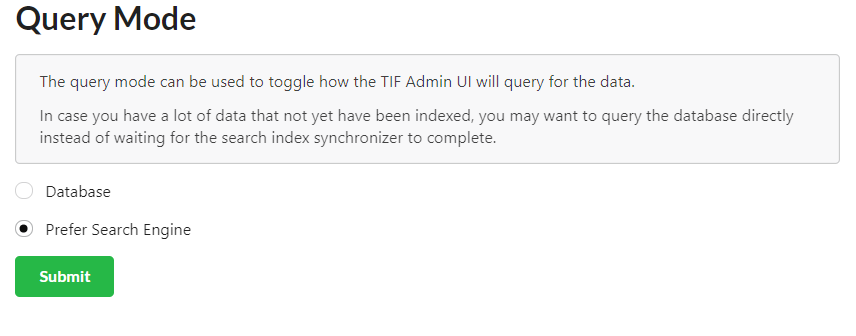
Figure 2. Query Mode Settings
Note that after changing the mode to "Database", the global query will not be available and possible other features as well.
You should toggle this back once your search index is up-to-date with the TIF database.
2.2. Re Indexing
It may happen that your search index is lost or needs to be re-created for one or another reason.
From the TIF Amin UI you can mark jobs that needs to be re-indexed via the "Data Indexer" page as seen below.
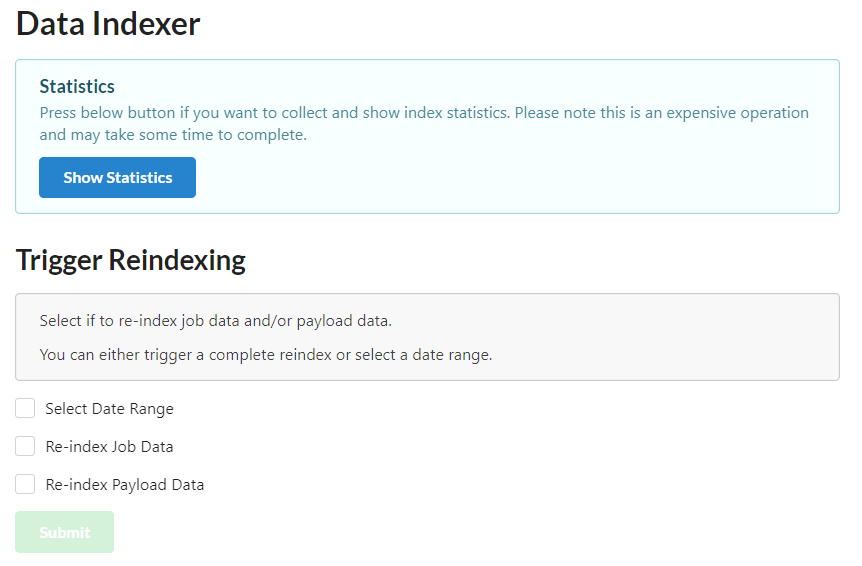
Figure 3. Re-indexing
You can from this page also statistics regarding how much data that is unindexed. To do so, you need to click a separate button that will load this information. That action will take some time in case you have a large database.
Here you select what data (or all) that should be marked for reindexing. You can also specify a date range, e.g. after/before/between.
| The reindexing will take place as soon as the Search Index Synchronizer is triggered the next time. |
3. Navigation
Navigation in Admin UI is straight forward. The top menu panel is always available and provides access to all functionalities in the Admin UI.
3.1. Login
To access Admin UI, you are required to login with administrator user name and password.
Figure 4. Login
See this page how to configure password.
3.2. Dashboard
Once logged in you will reach the dashboard. It shows an overview of recent activities in TIF.
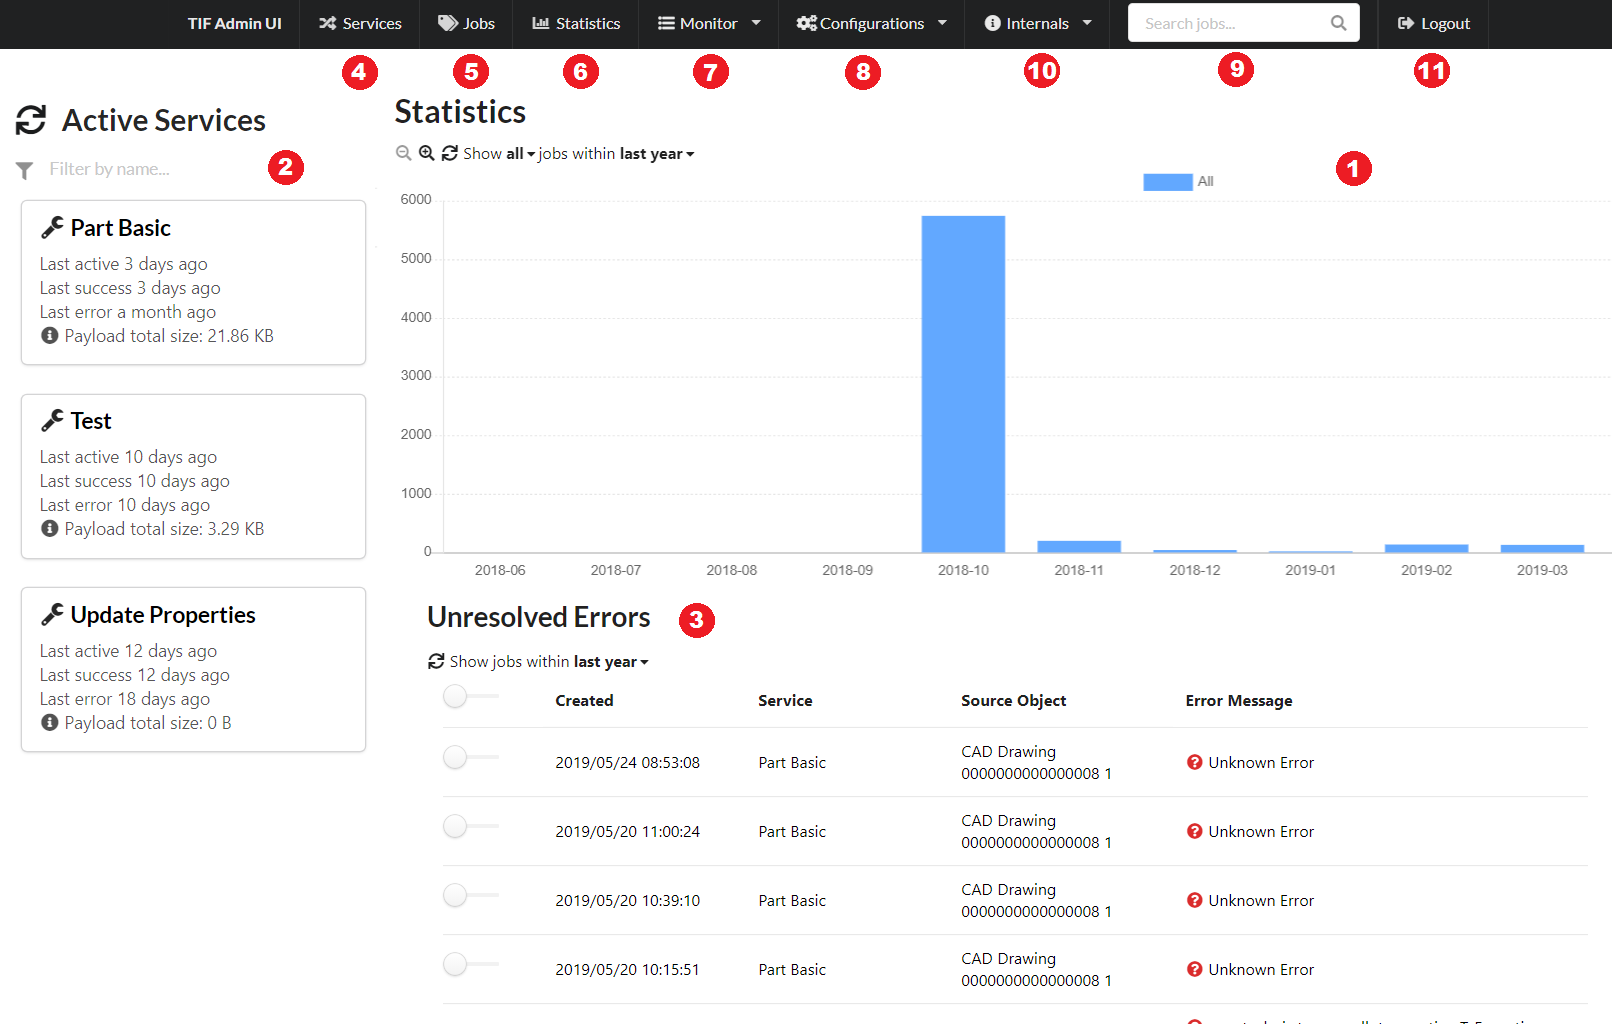
Figure 5. Dashboard
You can do the following:
-
See throughput statistics across all services
-
See list of recently active services on the TIF server
-
See most recent jobs that have failed.
-
Global search enabled if a Search Indexer has been configured.
-
TIF Internals, such as indexer/query settings, see version and license details etc.
-
Log Out
3.3. Services
TIF supports different types of services: inbound and outbound integrations, batch jobs and web services. In the Admin UI they are displayed together with the common name "Service".
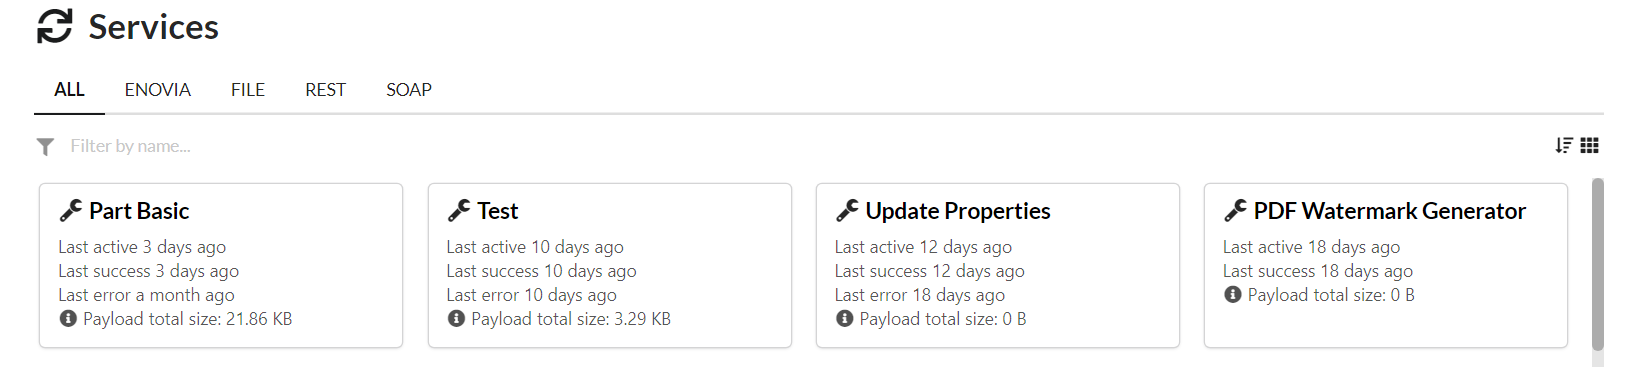
Figure 6. Services
In the services view, it is possible to list services grouped by their type. In addition, the list may be shown as tiles or as a list, filter services by name and sorted by different criterias.
|
As of TIF 2017.2.0, service type MESSAGING is deprecated. Instead, new services in this category appear in Admin UI with more specific type such as AMQP, JMS and MQ. However, existing MESSAGING services registered in TIF’s DB are still visible with legacy type MESSAGING in Admin UI. |
3.3.1. View Service
In Service view you find information specific for that service. For instance you find throughput statistic and a list of jobs for the service. The view also contains a chart that displays filtered jobs as graphical columns. There are unit and zoom selections available for the chart.
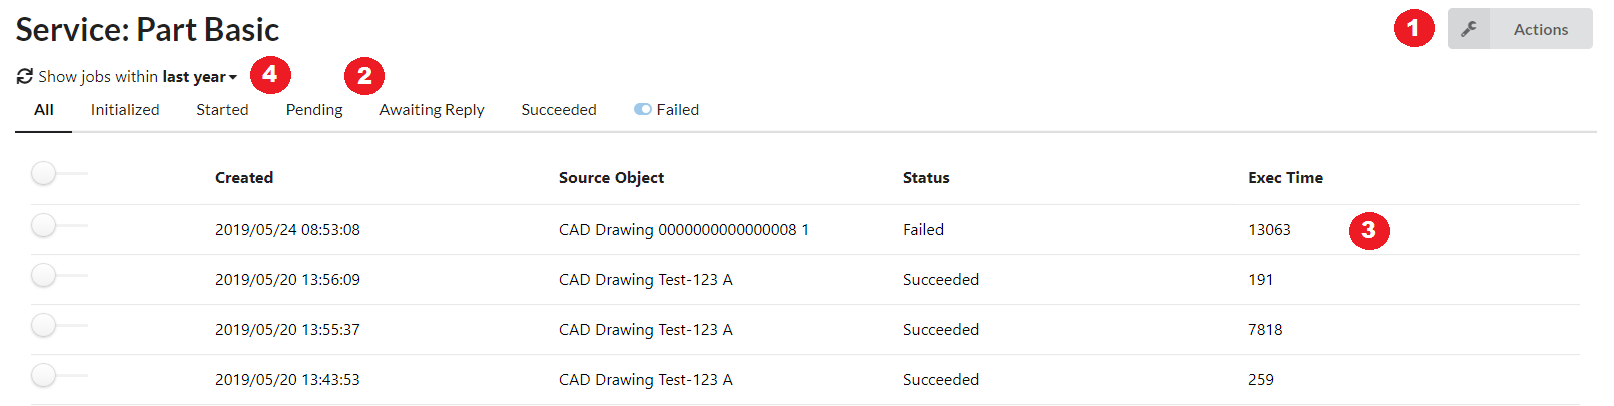
Figure 7. Service View
-
From Action menu you can view service settings, create, delete and export (CSV, PDF) jobs. If the service is of type ENOVIA, you may also resend one or more jobs that are completed with errors.
-
Jobs are filtered by status which can be selected using buttons in the view.
-
Job View shows details of job. Press row on the table.
-
Table contents can be refreshed and filtered by date. When changing the date, table can be reloaded from the refresh icon that appears on orange color.
The information displayed for each job is slightly different depending on what kind of service you are looking on. For instance are the input parameters supplied by the user visible when viewing a web service, but no such information exists when viewing a message integration service.
3.3.2. Delete Service and Jobs
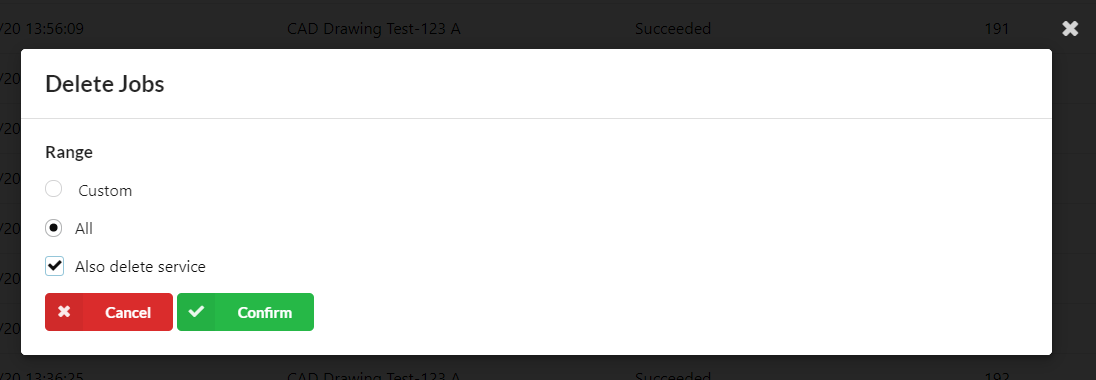
Figure 8. Delete Actions
It is possible to delete jobs with custom date range or all jobs from a service. When deleting all jobs, only completed, pending or awaiting reply jobs are deleted. Jobs that are initialized or being processed are excluded.

Figure 9. Delete All Jobs
When deleting the service, it will also delete its all jobs.
| When deleting the service, make sure it does not have jobs that are initialized or being processed as those will prevent the deletion. |
3.3.3. Service Settings
In Settings view you can specify the number of days to keep jobs for this service. To disable clean up of jobs, enter value "-1".
Also it is possible to set up service to store (or not to) payload data of jobs.
To view current XML configuration of the service, press "View Configuration" link. See also chapter Configuration.
| It is not possible to view configurations of service of deprecated type MESSAGING. See Services. |
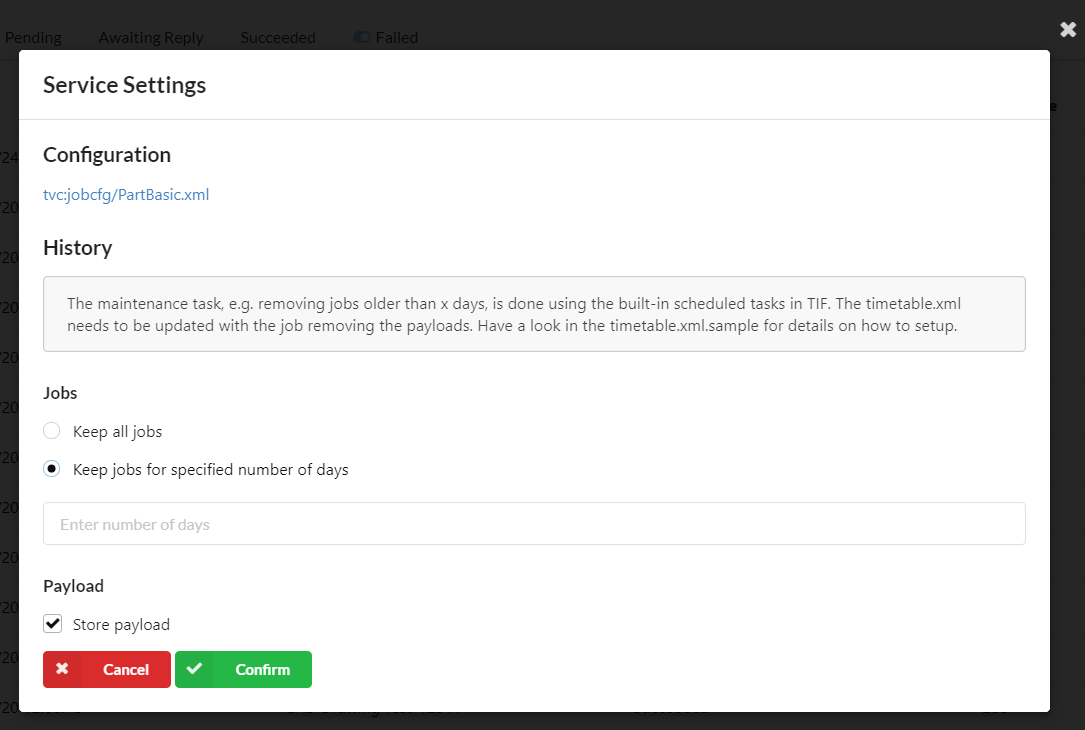
Figure 10. Service Settings
3.4. Jobs
Jobs view provides an overview of jobs from all services.
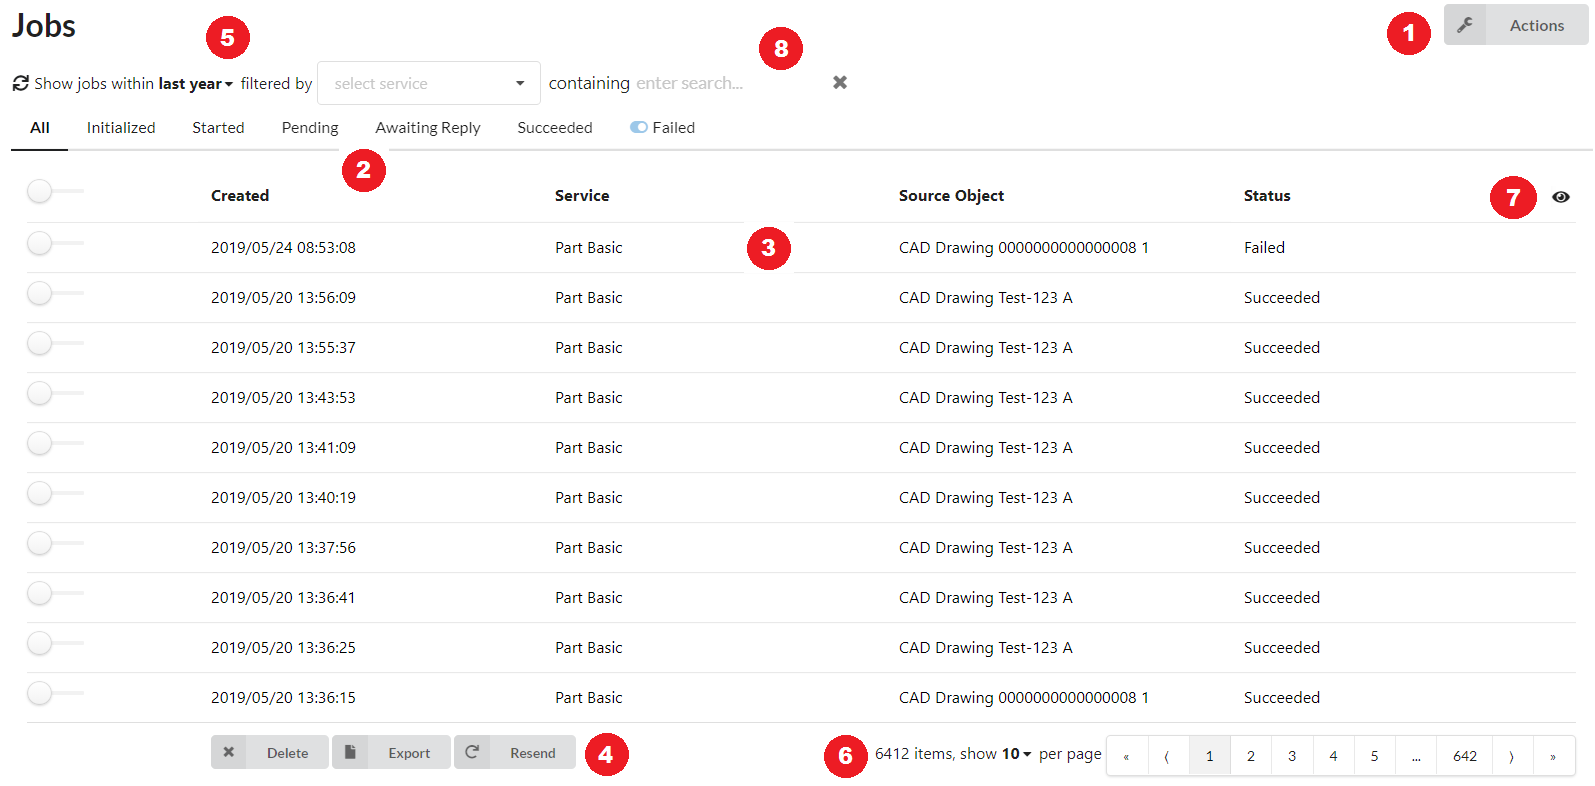
Figure 11. Jobs
-
From Action menu you can create, delete, resend and resolve jobs.
-
Jobs are filtered by status which can be selected using buttons in the view.
-
Press table row to view a job.
-
Jobs found with the current filter can be deleted, resent or resolved (depending on the state).
-
Jobs can be filtered by date and/or service.
-
Table pagination actions.
-
Access table column visibility settings.
-
Search jobs.
Table column order can be changed by dragging column headers.
| Table column order and visibility settings are stored in browser’s local storage. If the storage is cleared, the settings are also reset. |
3.4.1. View Job
All details regarding the job is found on the Job view. What information that is displayed is dependent on what kind of service the job is. For message integrations you can for instance see the payload and destinations.
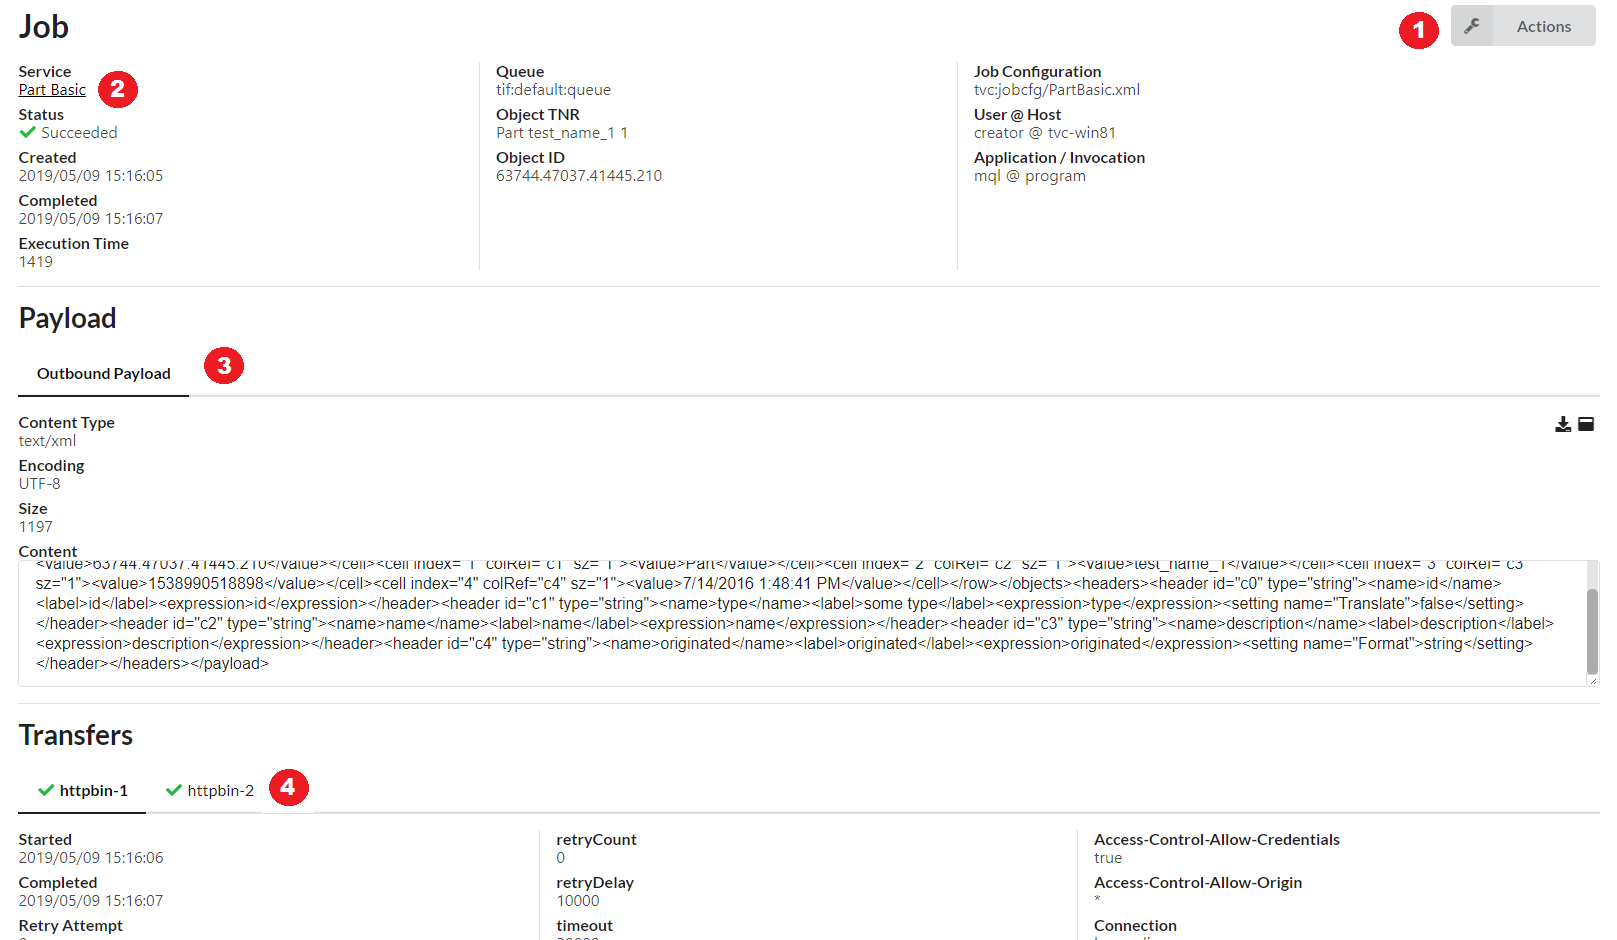
Figure 12. Job View
-
From Job Actions you can manage job.
-
Service View is accessed from service link.
-
Outbound and/or inbound payloads can be viewed from Payloads section.
-
For outbound jobs, transfers section displays transfer statuses for each destination.
3.4.2. View payload
The admin UI will only display payload having certain content-types. Moreover, payloads having a size larger than a certain threshold should never be displayed in the admin UI.
In addition, you can now also download the payload data from the TIF admin UI to your local computer.
These settings are defined within the ${TIF_HOME}/modules/enovia/etc/module.properties file and the particular settings
controlling these behaviors are:
adminui.payload.sizeThresholdForDisplay=5KB
adminui.payload.displayableContentTypes=application/xml,text/xml,text/plain,text/csv,application/json
adminui.payload.allowDownload=true- adminui.payload.sizeThresholdForDisplay
-
If unit is omitted, bytes is the assumed size. Note that if set to a negative value, the size limitation is disabled. Allowed units are: b, bytes, k, kb, ki, kib, m, mb, mi, mib, g, gb, gi, gib.
- adminui.payload.displayableContentTypes
-
Comma separated list of allowed content types.
- adminui.payload.allowDownload
-
Whether or not to allow downloading the payload from the admin UI.
3.4.3. Job Actions
Depending on service type, there are one or more actions available to manage jobs.
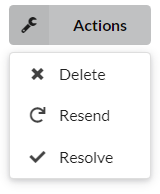
Figure 13. Job Actions - Resend, Delete and Resolve
-
For outbound integrations it is possible to resend a job that is of type ENOVIA. This will create a new job, process it and deliver it to all destinations.
-
Job and its information may be deleted.
-
In case job is completed with errors, you may either Resolve or unresolve it.
3.4.4. Abort Job
If job is awaiting reply, it can be aborted. This is useful in case of reply is never received. Aborting means job will be completed with error and message "Job aborted by admin".
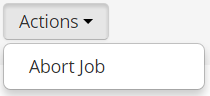
Figure 14. Job Actions - Abort
3.4.5. Resolve Job
When a job is completed with errors, it might be useful to indicate when an administrator has taken care of it and error is resolved.
Once resolved, the job it is not visible in the list of errors in Dashboard. Also in Service View and in Jobs view jobs can be filtered by resolve status.
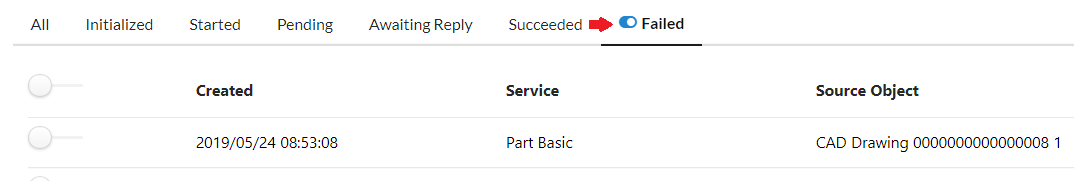
Figure 15. Resolved Jobs
-
It is possible to view only those jobs are unresolved by clicking on the toggle button.
3.4.6. Create Job
Usually jobs are triggered from ENOVIA application, but it is also possible to create jobs manually from Admin UI. This is available in action menu of Jobs.
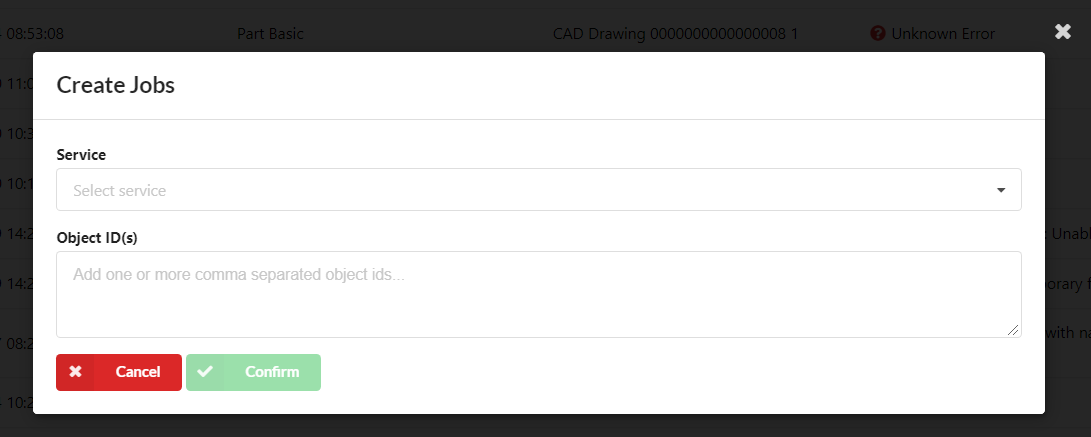
Figure 16. Create Job
-
Select what service to create jobs
-
Provide object ids. Multiple object ids are separated with commas (,). If no object id is provided, a confirmation dialog is displayed to verify the job is created without object id.
3.5. Statistics
In Statistics you can see a chart that displays job counts with selected criterias. You may include jobs from all or only from selected services.
When criteria is changed, the reload icon turns into orange to indicate reload is needed. Press the icon to apply changes and reload the statistics. You may also press the icon whenever to reload statistics.
Zoom buttons is used to adjust the time interval of the chart.
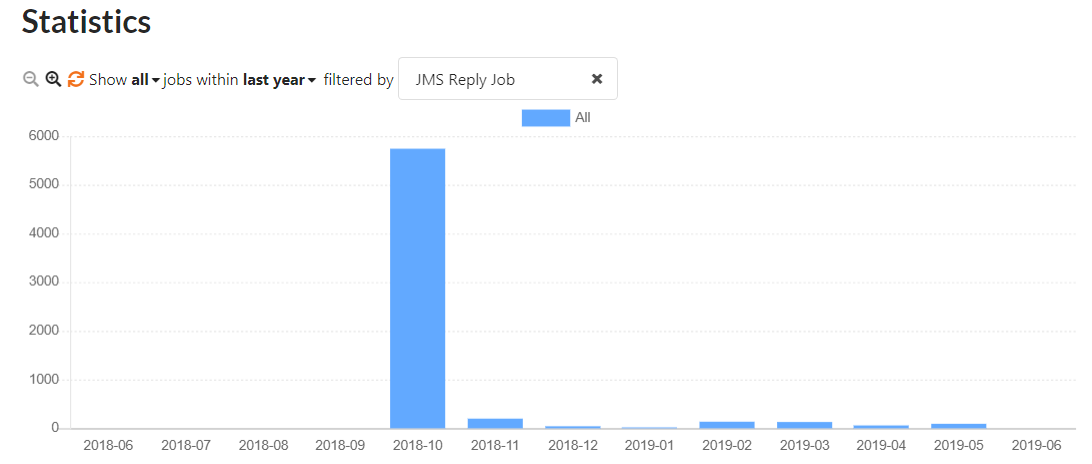
Figure 17. Statistics
You may also drill down into statistics by clicking on bar elements in the chart. Drill-down changes the date range of statistics according to the selection and opens a table containing jobs of the selected range.
| When drill-down is active, selected criteria cannot be changed. You may reset the filter by clicking on the reset icon. |
-
Filter reset icon
-
A chart bar that can be clicked
-
Table displaying jobs that matches with drill-down range
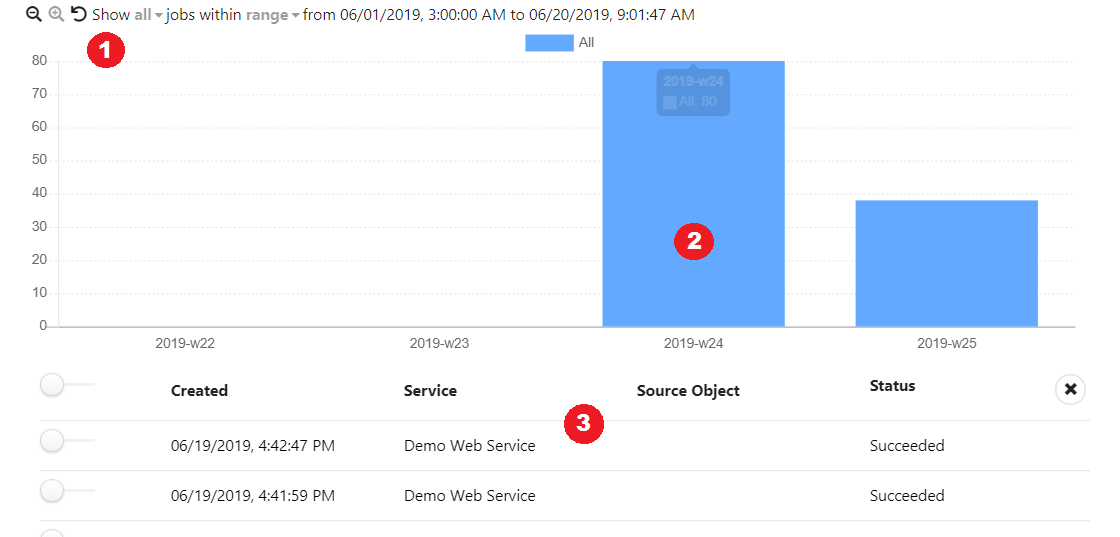
Figure 18. Statistics
3.6. Monitor
In Monitor view administrator can see Applications Events, monitor resources and start or stop service activators.
3.6.1. Application Events
In this view you can browse application events.
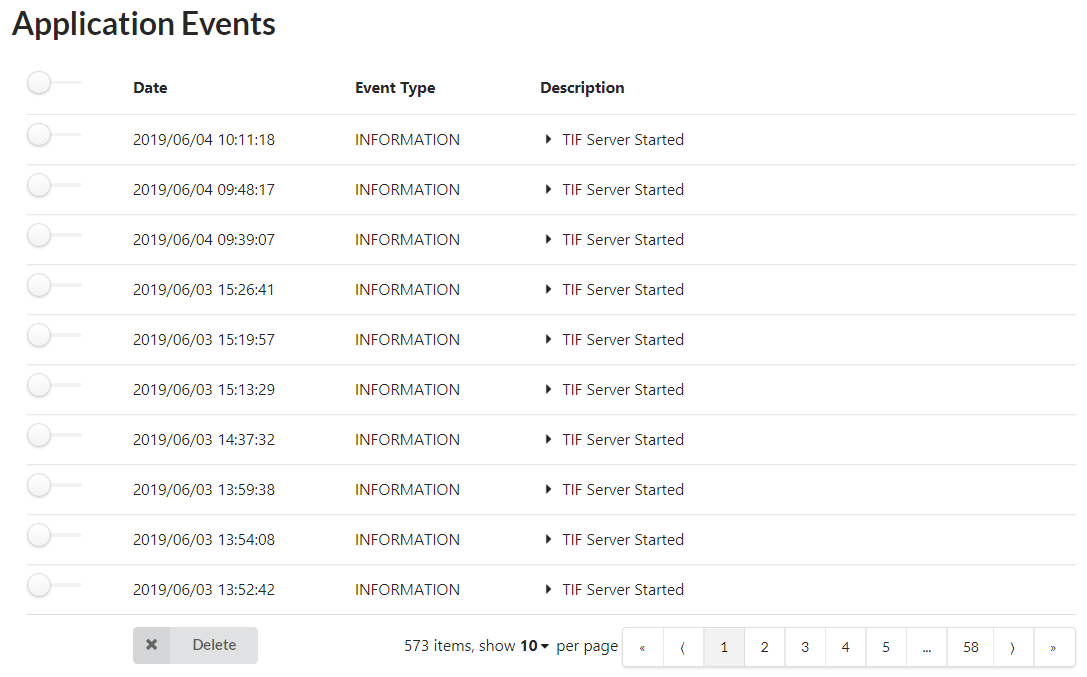
Figure 19. Application Events
The following can be done:
-
Applications Event details by clicking on table row.
-
Delete event from the list.
-
Delete all events.
3.6.2. Job Queues
This view displays an overview of Queue objects located in ENOVIA database.
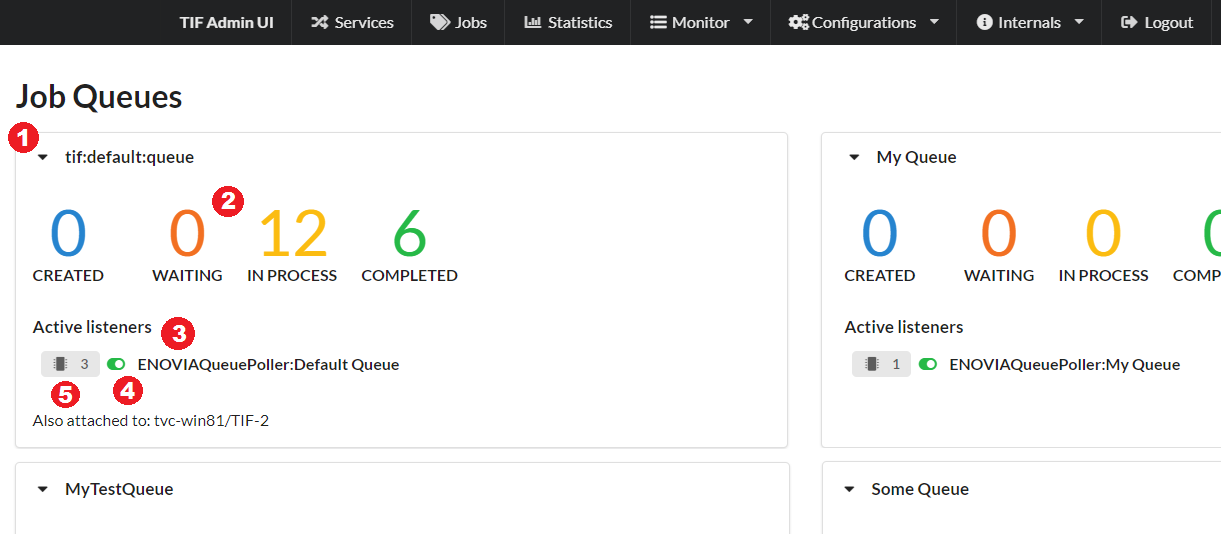
Figure 20. Job Queues
The view contains:
-
An icon to expand and view queue statistics and details
-
Statistics that are grouped by job object state. A statistic number can be clicked to view jobs in the particular state.
-
Active listeners are displayed below statistics.
-
A listener can be started/stopped from the toggle icon.
-
Thread count of a listener can be adjusted.
Thread count setting
In the popup, you may adjust the thread count value. In practice, the queue listener is assigned with the value and restarted if needed. This does not affect on jobs that are already being executed.
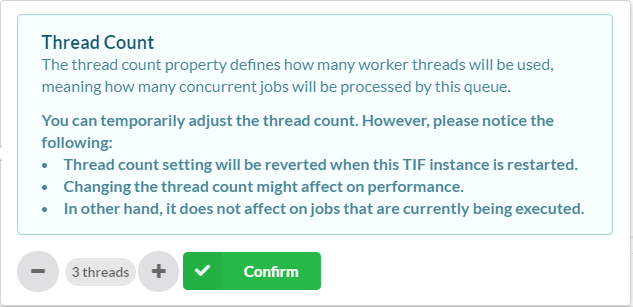
Figure 21. Thread Count
Job details
Jobs in a particular state can be viewed by clicking on a statistic number. The view displays job and source object information and job configuration. Each row in the table can be expanded to view details such as RPE and job parameters.
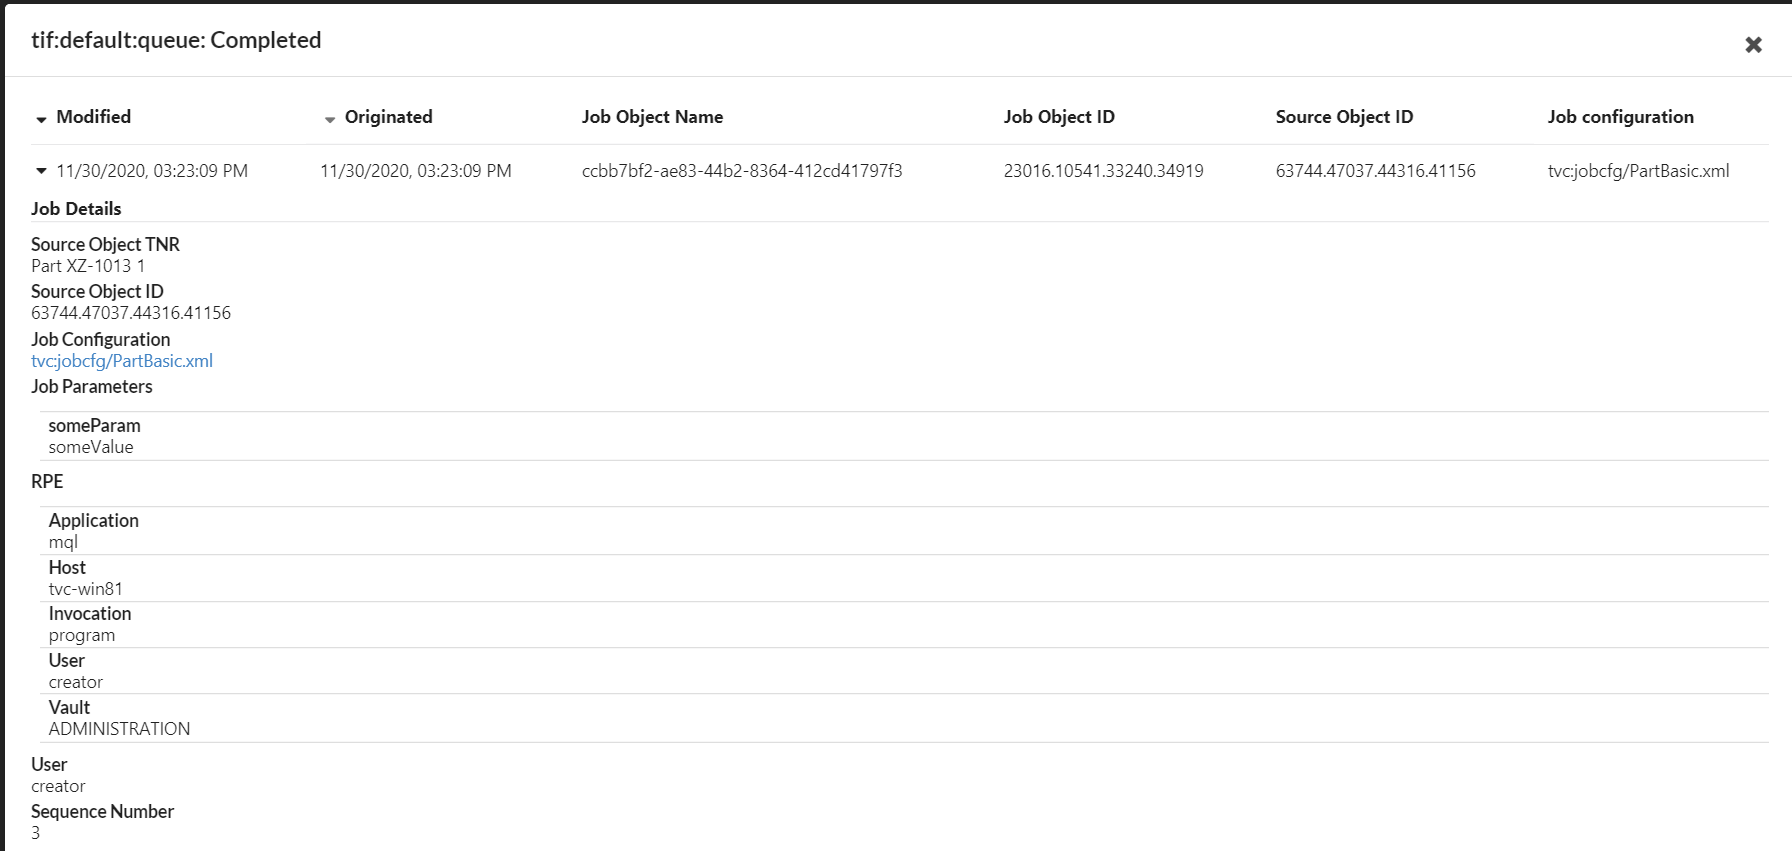
Figure 22. Job Details
3.6.3. Resource Monitor
Resource monitor displays graphical presentation of recent resource consumption. Charts include CPU, JVM heap and ENOVIA memory usage. In addition, it is possible to configure one or more file system locations of which disk space is monitored.
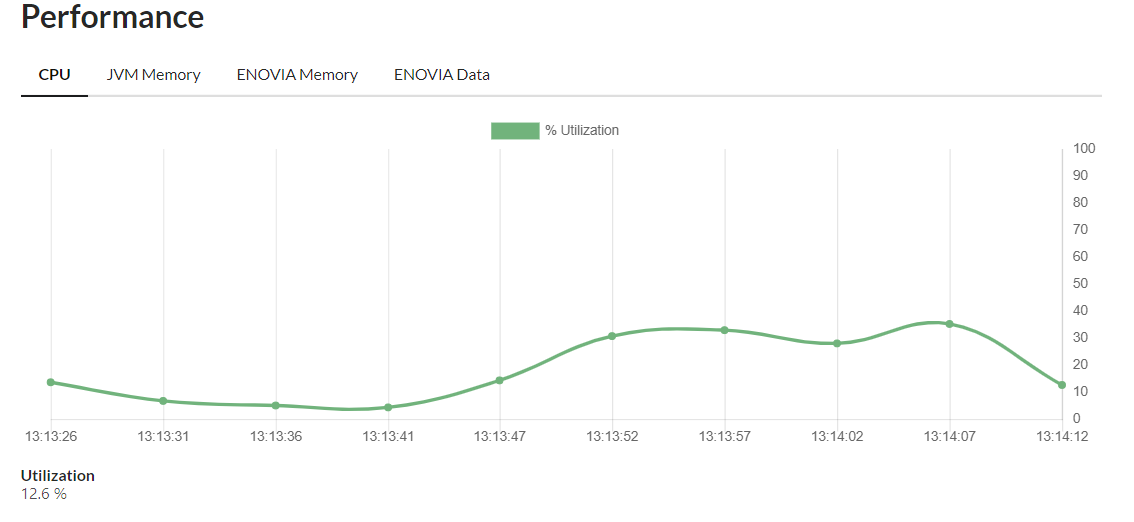
Figure 23. Resource Monitor
Also see chapter Monitor configuration to learn how to enable disk space monitoring and/or change update interval of charts.
3.6.4. Service Activators
In this view you can see service activators.
To start or stop an activator, press toggle button that is shown on left of activator name.
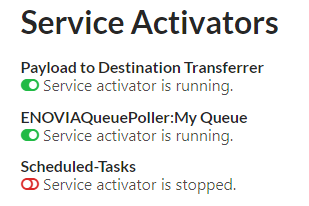
Figure 24. Service Activators
3.6.5. Scheduler Jobs/Logs
This view will show the currently configured jobs being managed by the scheduler in TIF.
You will from this view be able to view the history from the last executions of a job including inactivate / activate jobs and trigger a new execution of a job.
You can maximum view the last 20 executions of a particular job.
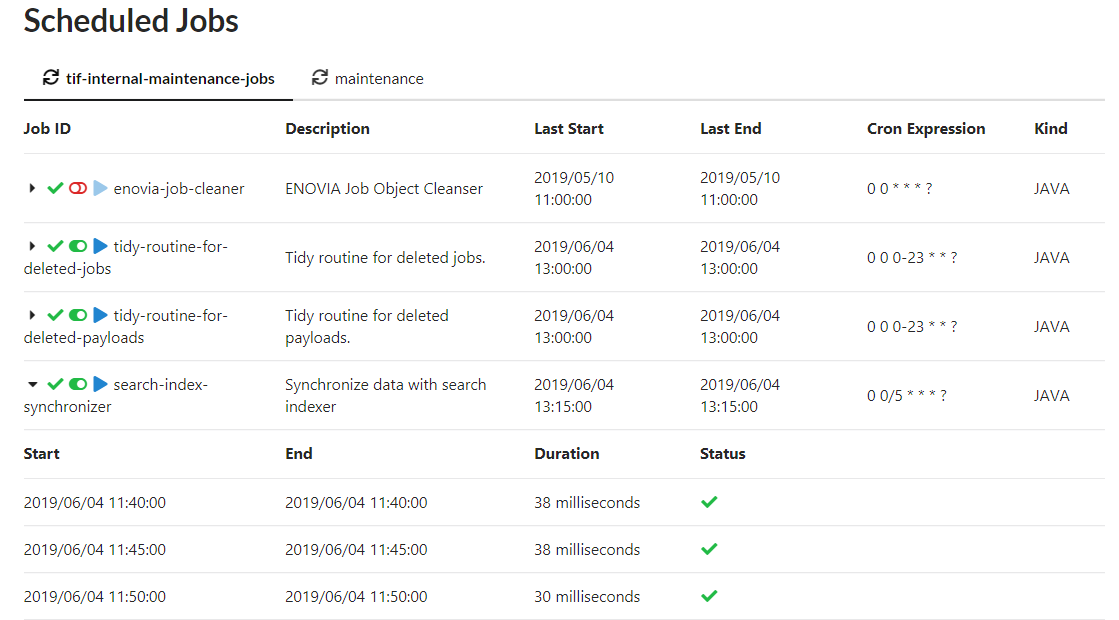
Figure 25. Scheduled Jobs
4. Configuration
The Admin UI contains features that can be configured in ${TIF_ROOT}/modules/enovia/etc/module.custom.properties.
Please see ${TIF_ROOT}/modules/enovia/etc/module.properties that contains detailed explanation for each property.
4.1. User Name and Password
The default login user name is admin and the password is set in ${TIF_ROOT}/modules/enovia/etc/module.custom.properties.
User name and password can be changed with properties user.admin.name and user.admin.password.
The password may be encrypted. Please read comments in module.properties to learn how to encrypt password with MQL.
For example:
user.admin.name = admin
ENOVIA encrypted password:
user.admin.password = enovia:xxxxxxxx
Base-64 encoded password:
user.admin.password = b64:xxxxxxxx
Plain password:
user.admin.password = plain:xxxxxxxx
where "xxxxxxxx" is encrypted, encoded or plain password.
4.2. Monitor
Configurations introduced in this chapter apply to Monitor view.
4.2.1. Resource Charts
Reload delay of charts displayed in Monitor Resources view can be adjusted. See property resourceChart.reloadDelay.
For example:
resourceChart.reloadDelay = 5000
The value must be in milliseconds. The minimum delay is 5000ms.
4.2.2. Free Disk Space
In Monitor Resources view, free disk space can be monitored from one or more locations in the file system. See property adminui.resourceChart.diskSpace.path.
For example:
adminui.resourceChart.diskSpace.path = C:
The property is a list of paths from which disk space is monitored. Each path must point to an existing location in the file system.
4.2.3. Units
In Monitor Resources view, unit for measuring used JVM heap and ENOVIA memory and used disk space can be configured. See properties:
-
adminui.resourceChart.unit.memoryData -
adminui.resourceChart.unit.enoviaData -
adminui.resourceChart.unit.diskSpaceData
For example:
adminui.resourceChart.unit.memoryData = MB
Supported values for properties are: MB, GB or TB. Default is MB, if value is empty.
4.3. Maximum Number of Rows in Job Table Export
When table contents are exported, the maximum number of rows is limited. See properties:
-
adminapi.export.csv.maxRows -
adminapi.export.pdf.maxRows
4.4. Log settings
Configurations introduced in this chapter applies to the Log Settings view.
4.4.1. Runtime Log Levels
You may configure the list of features that appears in the Log Settings view. Runtime log level for these features can be adjusted from that view.
A feature can be added to the list by introducing new property in the following format:
logPackages.FEATURENAME=a.b.c, d.e.f
Property name must contain prefix logPackages.FEATURENAME., where FEATURENAME is a unique name for the feature.
Property value is a comma separated list of package name(s) that belong to the feature.
In this example, level change of feature FEATURENAME would affect classes that belong to package "a.b.c" or "d.e.f".
4.5. Configuration Editor
The configuration editor can be accessed from the "Configuration" menu.
With the editor you may read and modify configuration files that are accessible by TIF, typically located under ${TIF_ROOT}/modules/enovia/cfg and webapp folders.
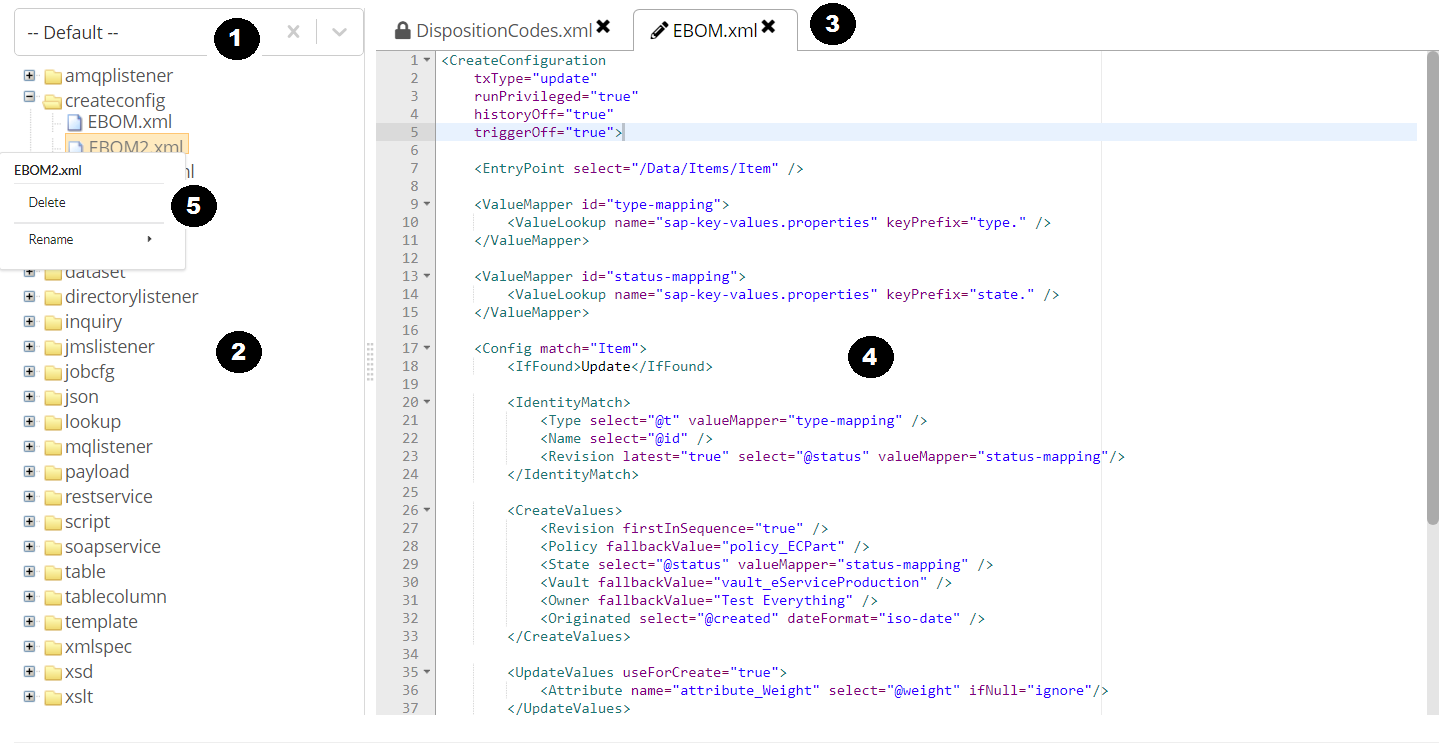
Figure 26. Configuration Editor
Overview:
-
Namespace selector.
-
Tree view lists files found from selected namespace. The files are grouped by resource type.
-
File name tab panel displays opened files.
-
Editor view displays the contents of opened file.
-
Context menu that be accessed by right clicking on file or folder.
The editor has some restictions:
-
For security reasons, files that are located outside the folder
${TIF_ROOT}/modules/enovia/cfgcannot be deleted or renamed and can be viewed only in read-only mode. This is indicated with a lock symbol in file name tab panel. -
New files are always created in a sub folder under
${TIF_ROOT}/modules/enovia/cfgaccording to the selected type and namespace.
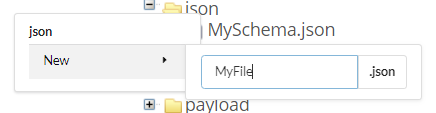
4.5.1. Create Namespace
New namespace can be created by typing name into the namespace selector field and pressing "Create …" action below the selector.
To avoid creating possibly unnecessary empty folders, a folder for new namespace is created under ${TIF_ROOT}/modules/enovia/cfg only after the first resource (of any type) is added. If you create namespace but do not add any resources, the namespace disappears from the namespace selector list if you reload the editor.
|
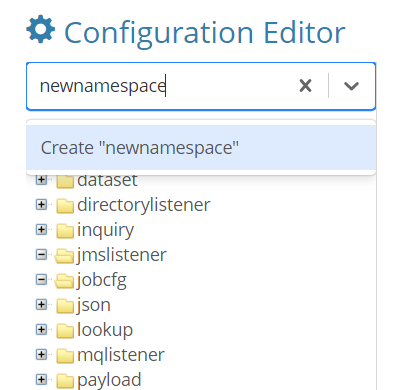
Figure 27. Create namespace