Usage
Starting the Client
| The profiler client requires a minimum of Java 11 JVM to be used. |
-
To start the client
-
java -jar d:/apps/profiler/profiler-client.jar
-
assuming that you have installed the profiler into the "D:\apps\profiler" folder.
-
-
First Run - Select License
-
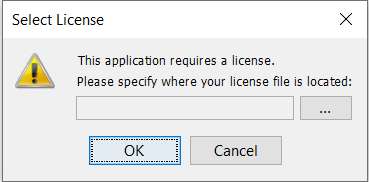
The first time the Profiler client is launched, you will be queried for a valid license.
-
-
Use the browse button (…) to locate your "technia.license" file. Once done, click the "OK" button.
-
The selected license will then be installed into the folder "~/.technia/profiler" (~ is the home folder for the current user).
| If you have obtained a license having an expiry date, you will be asked for a new license when the current license has expired. If you have obtained a full license and want to use this one before the current license has expired, you can delete the ~/.technia/profiler/technia.license file and install the new license when starting the profiler again. |
Main Screen
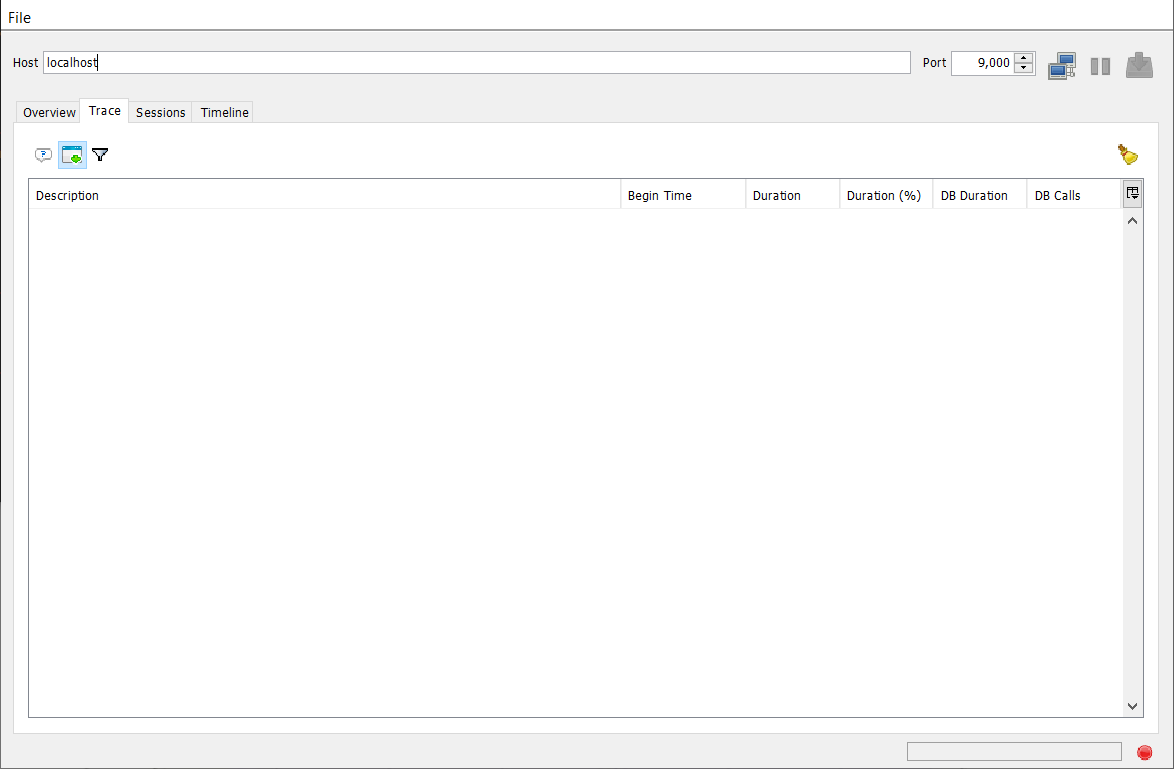
-
At the top of the screen, you can select the host/port of the profiler server you want to connect with.
-
The buttons at the top are explained in the table below:
| Icon | Action | Description |
|---|---|---|
|
Connect/Disconnect |
Connects to the profiler server using the specified host and port. Once connected, use this button to disconnect from the profiler server. |
|
Pause/Resume |
When connected, use this button to pause the profiling. While paused, all profiling information is not collected. Click on this button again to resume the collection of profiling data. |
|
Save Session |
When you have completed the profiling and closed the current connection, you can use this button to save the session for later analysis. |


Tabs on the Main Screen
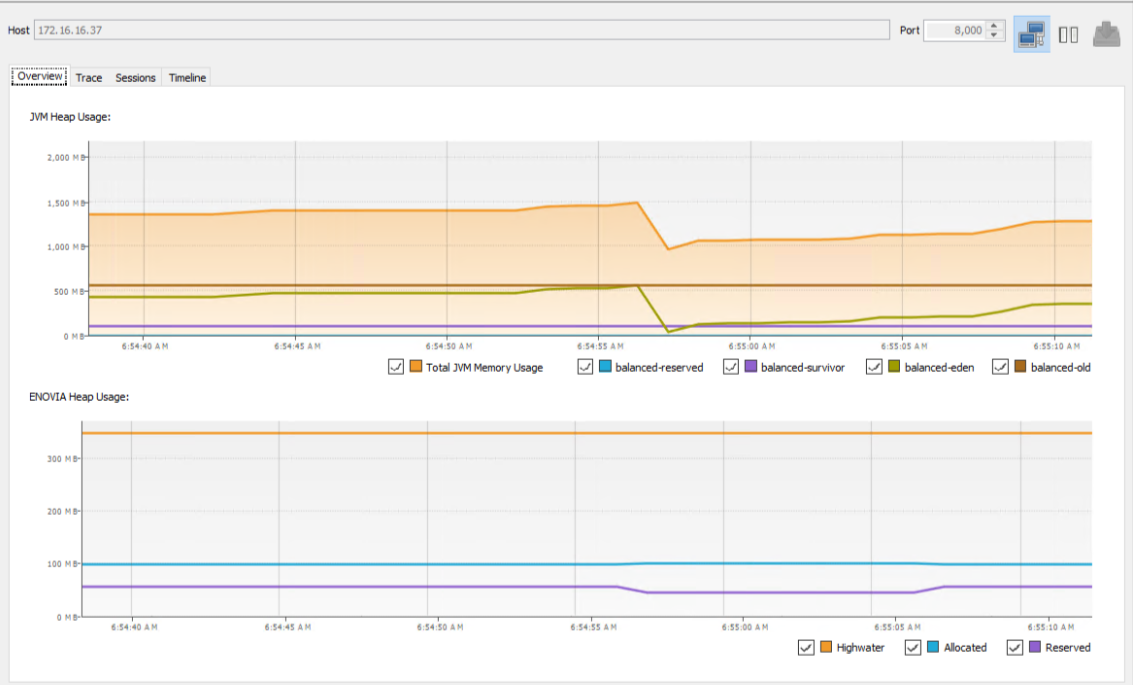
Tab: Overview
-
The tab screen shows an overview of the memory used by the application server.
-
You will see the memory reported by the JVM at the top and the memory reported by ENOVIA at the bottom.
-
The ENOVIA memory status is determined by the profiler server by periodically running the "monitor context" command.
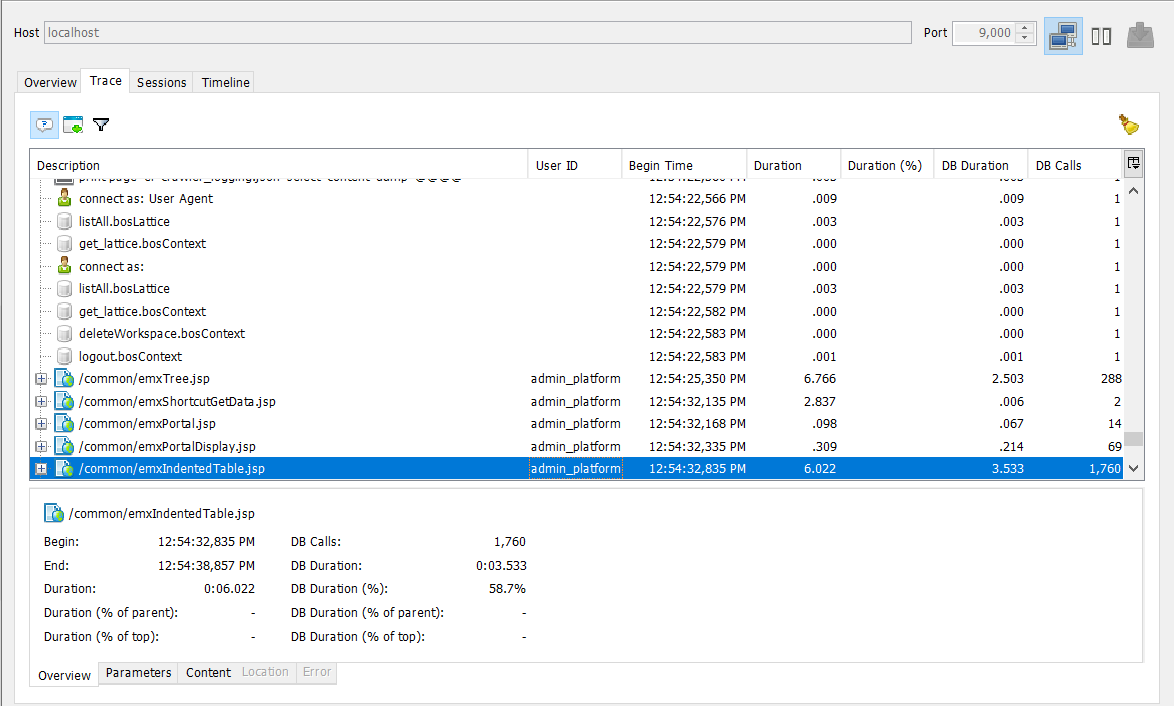
Tab:Trace
-
The trace tab shows all collected trace information from the profiler server. The trace information is shown in a tree widget containing columns that gives some relevant metrics.
-
When a node has been selected, you will at the bottom be able to see some additional information in a separate pane. This pane contains some additional tabs, which all are described later on in the chapter "Trace Node Details Pane".
-
The top nodes in this tree widget are the HTTP requests, and below the HTTP request level, you will see the DB calls being made to the ENOVIA kernel.
The buttons at the top of the trace view.
| Icon | Action | Description |
|---|---|---|
|
Toggle Details Display |
Hides/Shows the details pane at the bottom of the trace view |
|
Toggle Auto Scroll |
Enables / Disables the autoscrolling in the trace node view |
|
Filter |
Opens a dialog allowing you to specify filtering criteria. |
|
Clear View |
Clears the trace nodes (removes them from the view). |


Selecting Trace Node Columns
-
In the tree table widget you are also able to select what columns to be displayed. On clicking this button a window appears with the available columns to be used.
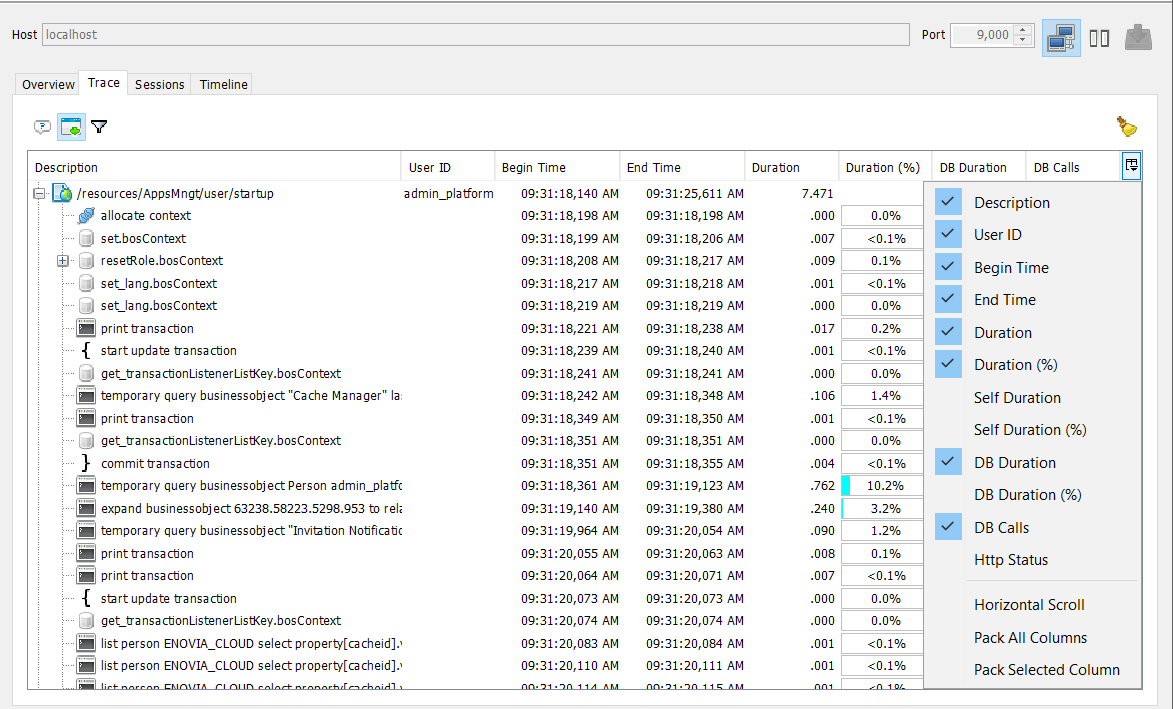
The available columns are:
-
Description
-
Gives a human understandable description of the kind of call *User ID (applies to request nodes)
-
The ID of the user initiating the request
-
-
Duration (%)
-
The duration in percentage of the DB call in the context of its parent node.
-
-
Duration
-
The duration in time of the call
-
-
DB Duration
-
The duration of the call within the DB
-
-
DB Calls
-
The number of DB calls (aggregated sum)
-
-
HTTP Status (applies to request nodes)
-
The HTTP status code for the request.
-
Filter Dialog
-
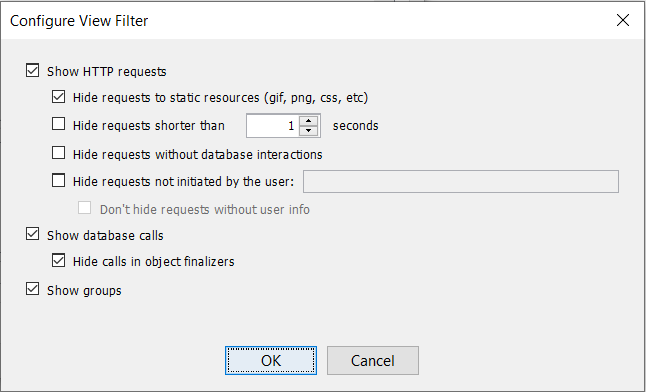
The dialog gives you some control of what trace nodes to be displayed in the tree widget.
-
For example, you can select to hide HTTP requests or hide HTTP requests to static resources. Moreover, you can select to only show requests that originates from a particular user.
-
The filter dialog contains the following.
Trace Node Details Pane
-
When selecting a node in the trace node tree widget, the bottom pane will contain some additional information about the selected node.
-
This pane contains a couple of tabs, described below.
Overview
-
Contains some metrics and additional information about the node, such as:
-
Type of Call
-
Start / End time + duration of DB call
-
Metrics about the node in comparison of the parent node and the top node (typically the HTTP request node).
-
-
The parent node might in some cases be a JPO invocation
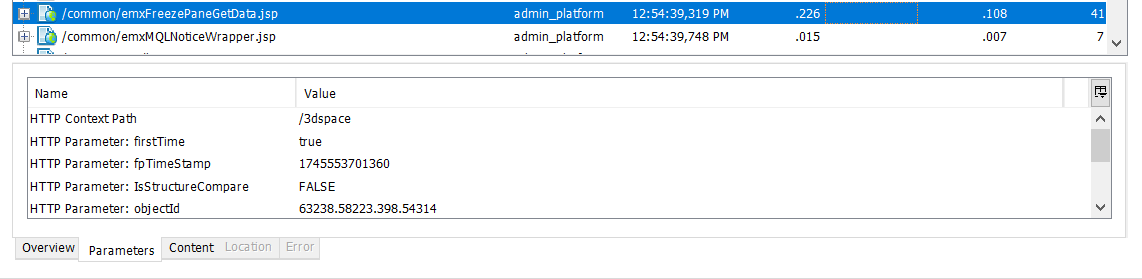
Parameters
-
Shows all parameters passed down to the ENOVIA kernel. The information depends on what kind of DB call the node represents, but could for example be:
-
Object IDs
-
Select Statements
-
MQL Command
-
Query details
-
…
-
The parameter information can be copied to the clipboard into different formats.
-
This is useful when you for example want to grab some object-ids and select statements and copy them to your TCL or Java code for further analysis (for example running a dedicated test-case or similar).
-
If a parameter represents an array of values, a button appears right to the parameter value allowing you to see all values in a popup window.
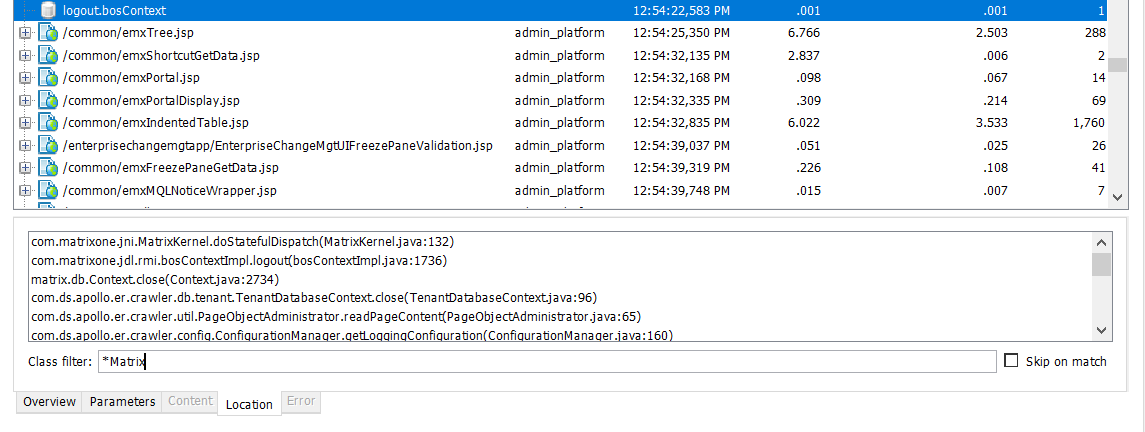
Location
-
The location tab allows you to "follow the stack" and identify what code that actually triggered a particular DB call.
-
The location tab shows the stack trace and contains a text field allowing you to filter away classes by typing in a filter.
-
The filter is a comma separated text string of class names. You can use wildcards to match multiple classes and you can specify whether or not to skip following classes in the stack upon match.