TVC Helium 2020.2.0 Release Information
15 April 2020
1. Core
1.1. Support for 2020x.
From this release and onwards, both TVC Helium and TVC classic has official support for use with 3DExperience (ENOVIA) version 2020x.
2. Table Column Builder
2.1. Columns defined by end users
|
This is currently experimental functionality, which means that we will continue developing it and that it is subject to change. |
End users can now add, remove and update columns in a table widget, with no need to involve an administrator nor changing underlying XML configuration files. This empowers users to set up their tables the way they prefer, with the columns that is relevant to them.
What this means in practice - users can now build their own tables!
The typeahead list of columns to choose from is based on the attributes of objects present in the table, including the unified type and interface attributes.
This feature is turned on with a tvc.property and configured by adding the Toolbar command <ToggleColumnVisibility addColumn="true" />
3. Widget
4. Table
4.1. Persistent Expand State
For back-and-forth navigations, it may be useful to persist the expansion state of a structure in a TableWidget. I.e. the structure will be expanded the same way the next time the same object view is loaded. This behaviour can now be configured. Refer datatable section for more details.
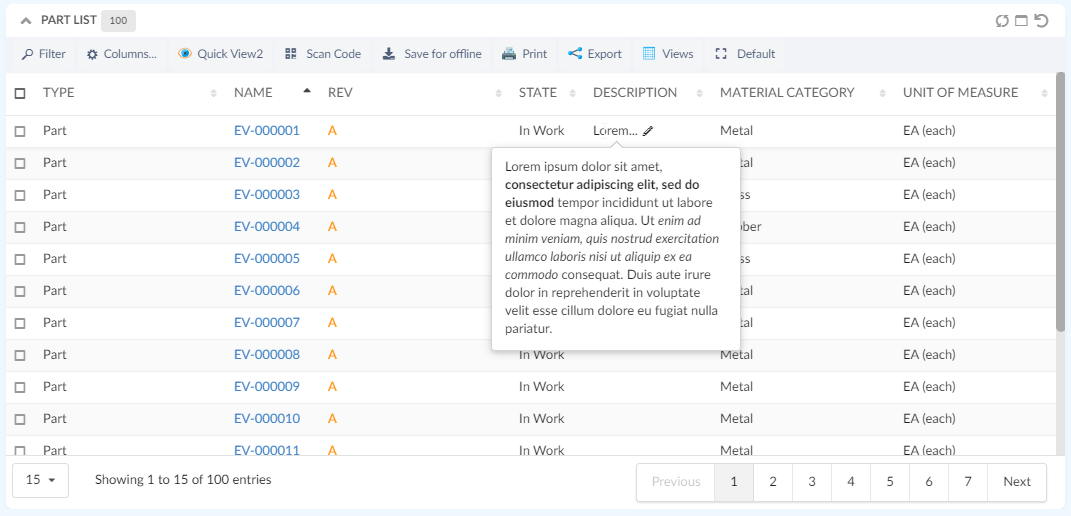
4.2. Support for text length truncation
To handle long text in table cells in a graceful way, it is now possible to configure a threshold limit (number of characters) to be displayed within the table cell. The full text (including HTML) content will be displayed as a tooltip when the user hovers their mouse cursor on the table cell.

See TextLength in column configuration.
5. Charts
5.1. Multi-value series support for chart widgets
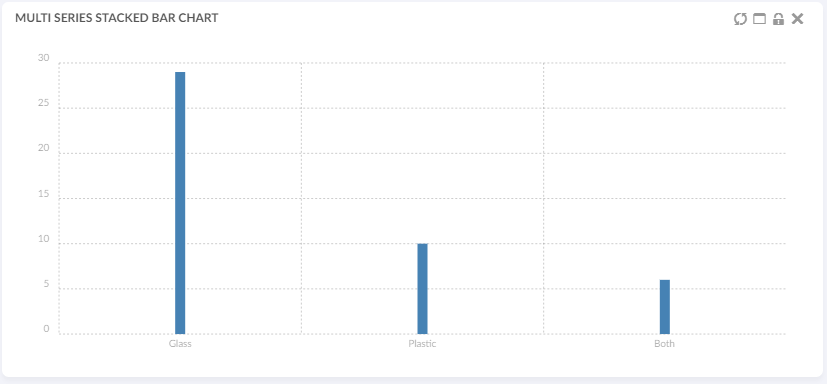
Chart widgets now support multi-value series, so that you can define a data series as an intersection of several values.

In the above example, we retrieve 33 objects and configure a Bar chart based on the Material Category attribute.
-
29 of these objects have the attribute value ‘Glass’
-
10 of them have the attribute value ‘Plastic’
-
6 of them have both attribute values ‘Glass’ and ‘Plastic’
6. Search
6.1. Search with special characters
To allow searching for texts which include Latin characters, entity_encoding for rich texts is changed to raw which was Html entity before. This encoding now makes it possible to search with Latin or non-English characters like å ä ö. The only exception to this rule will be XML entities like < > & which will still be encoded.
7. 3DDashboard
7.1. 6wTags for multiple widgets
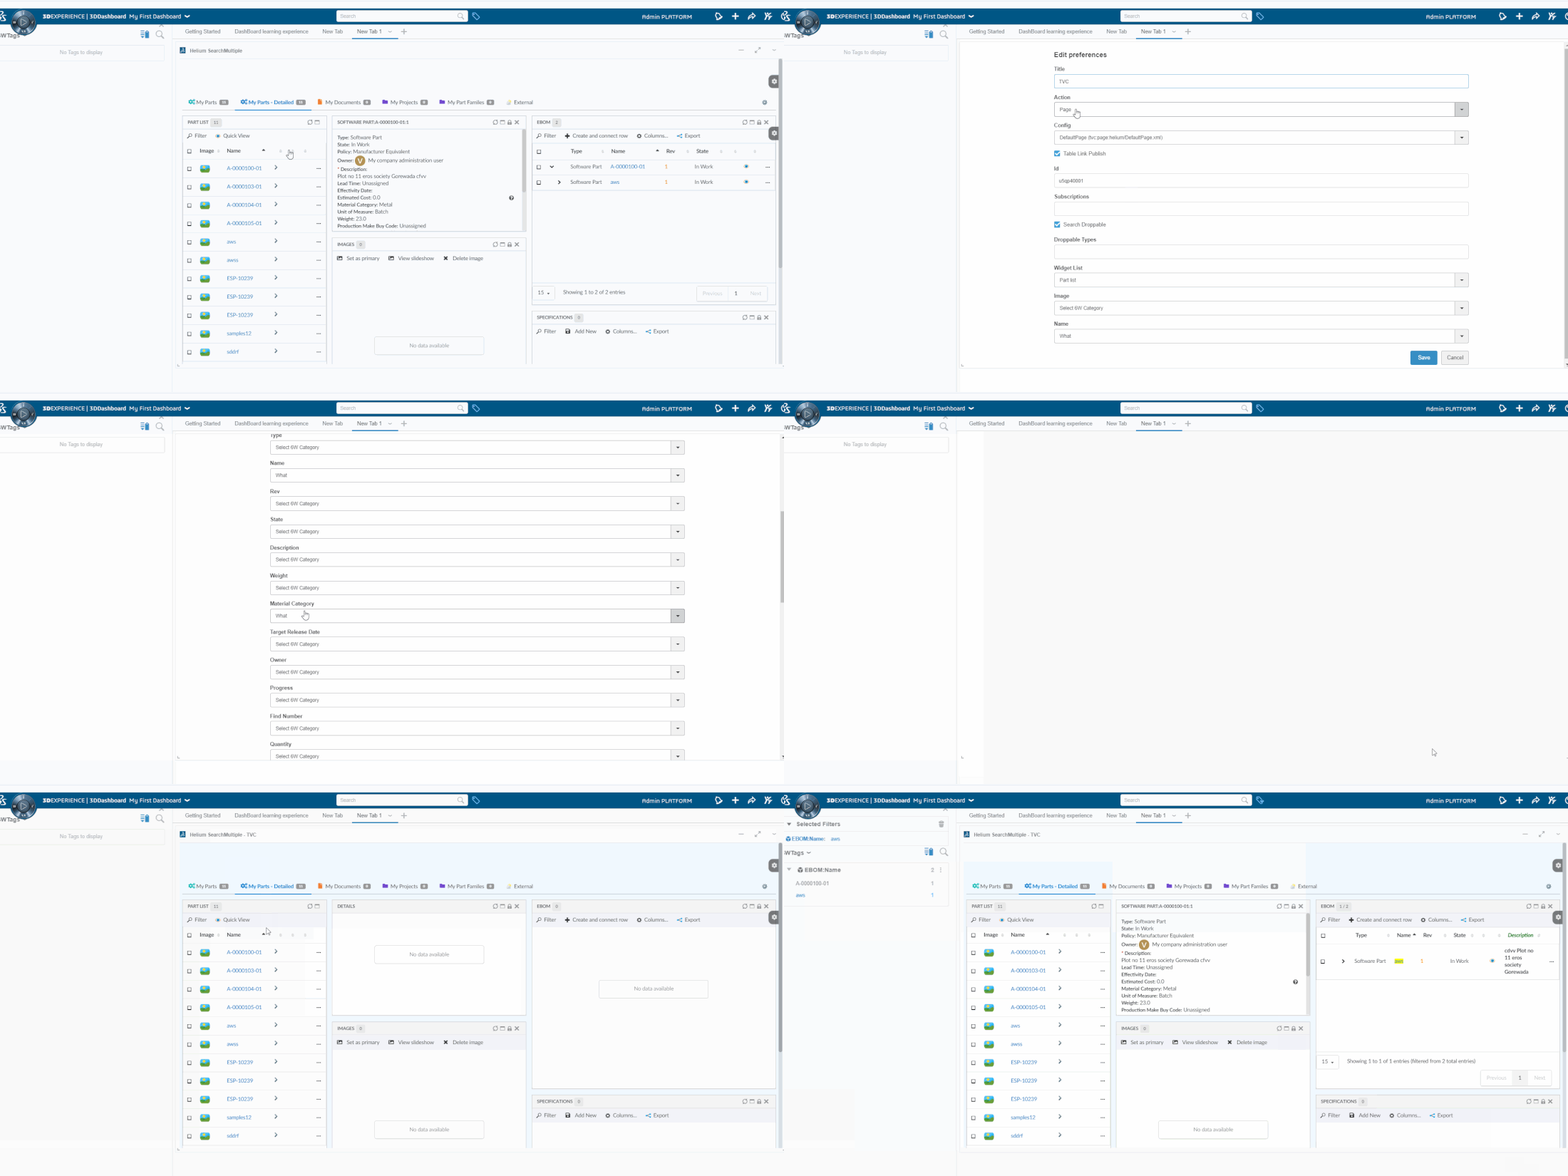
Support for creating 6WTags from multiple widgets.
When the user has multiple widgets within a tab, the user can choose a widget from the preferences menu and respective columns of the chosen widget will be displayed in the preferences. On the selection of the column, the column name & data will be added to 6wTags. More Details

 TVC Helium 2023.3.0