TVC Helium : End User Customization
08 June 2020
1. End User Customization
Enables the user to customize how the content/information is displayed in the application.
1.1. Widgets
Create and customize widgets.
1.1.1. Create widgets
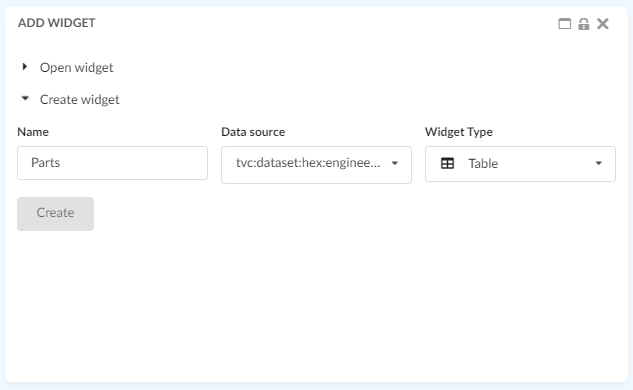
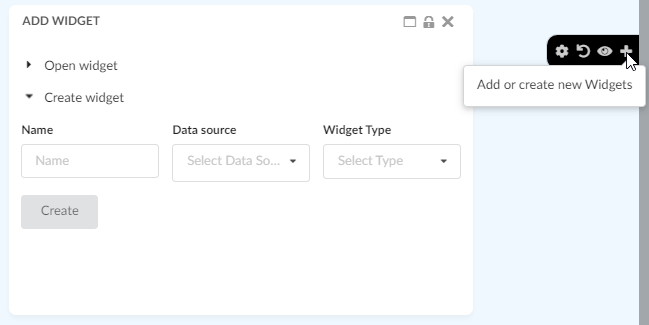
A user can add new widgets to a dashboard by using the + sign in the dashboard settings menu. This will open a form where you can create your widget/specify things about the widget you want to create, like the name of the widget, what data to be displayed and more.
Figure 1. Create widget
There are two types of widgets one can create, a chart widget or a table widget.
1.1.2. Charts
Create different type of charts. In the "Chart Type" field you can choose how you want the data to be displayed. You can choose from all the different chart types, e.g. Bar, Line, Pie or Donut. In the "Data Source" field you select what set of objects you want to base the chart on. The list is populated by the datasets cached in your application. In the "Chart Expression" field you choose what information you want to be displayed in the chart. You can choose from the basics and attributes of the objects from the dataset selected in the "Data Scource" field.
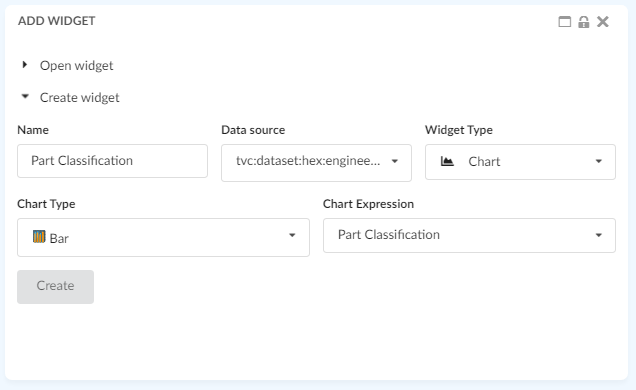
Figure 2. Create chart
For more information about charts in general, it can be found in the Chart chapter.