TVC 2009.2.0 Release Information
18 June 2009
1. Core
1.1. Installers
The TVC installer has been updated.
In earlier versions of TVC, the data model updates were made through the Java/ADK API. This had the side effect that one needed to have the ENOVIA™ license correctly setup on the machine, from where the installation were made from. As of this release, the data model is updated via the MQL executable. This doesn’t require the ENOVIA™ license setup.
This change requires you to provide the path to the ENOVIA™ studio installation directory when installing TVC.
Also, the UNIX installer will automate a number of steps that previously had to be done manually.
2. Grid Browser
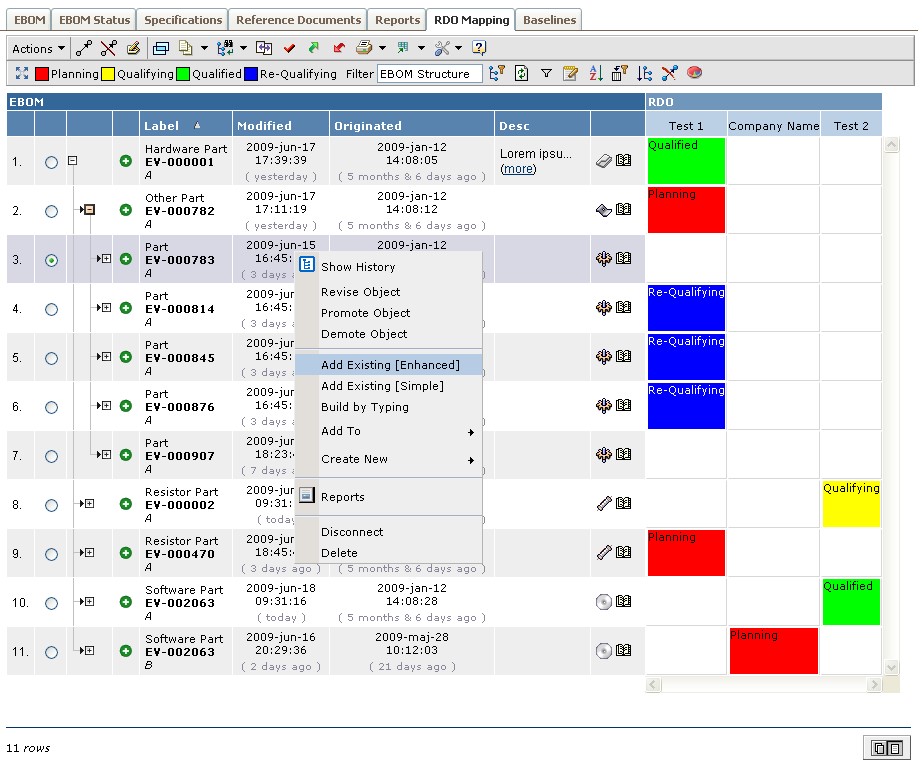
Major parts of the Grid Browser have been rewritten. The underlying rendering engine has been replaced with the same rendering engine used within the Structure Browser. This will both improve the performance and provide a large number of new features available within the Grid Browser.
A number of new features have also been added, for example:
Structure Browser functionality (sub set)
-
Context Menu on the row-axis objects
-
Toolbar context buttons:
-
Find/Search/Filter
-
Collection/Clipboard
-
Promote/Demote
-
Printer Friendly / Export
-
Preferences
-
Help Marker / Help URL o Other functionality
-
Filter chooser
-
Toggle edit mode
-
Column filter
-
Pagination Controls follows the user preferences
-
Build Structure / Quick Connect / Create Connect
-
-
Same data handlers and cell renderers can be used within the Grid Browser as in the Structure Browser.
Grid Browser Related
-
Access on Element actions and Global Actions (Mass actions)
-
Global actions can be configured to apply on elements in a particular state. Not only to elements being connected or not-connected (as earlier).
-
New element actions: Open link and Set attributes. The first will open a custom link for the element. The latter will set attributes without using a form (as edit attributes has).
-
Possibility to freeze the structure displayed. E.g. disallow further expand/collapses to be made.
-
Configuring of how to perform the expansions has been enhanced. o In addition to background color, also the font color can be changed for a particular state.
-
Form – The popup window size can be adjusted per form
-
Possibility to open row- or column- axis object within a structure browser instance "ontop" of the Grid Browser to allow for example editing. This can also be done for the elements within the intersection area.
-
PDF Export has been enhanced and the format of the content has been changed.
-
Excel export enhancements
Below is a screenshot showing the new user interface.
2.1. Configuration Format Changes
The goal has been to make the format compatible with previous versions of the Grid Browser. However, in some cases you might need to update old configurations. This is true especially if you have been using filters for doing the expansions.
Previously, the filters were defined using the following approach:
<Rows>
    <DataLoader>
        <Expand expandDepth="2">
            <Filter name="F1" role="role1"/>
            <Filter name="F2" role="role1"/>
            <Filter name="F3" role="maybe another role"/>
        </Expand>
    </DataLoader>
    <UIFunctions>
        <FilterSelector>
            <Filter name="F1" role="role1" active="true"/>
            <Filter name="F2" role="role1" active="true/>
        </FilterSelector>
        <ExpandAll/>
    </UIFunctions>
</Rows>
This must be changed to following:
<Rows>
    <DataLoader>
        <Expand>
            <Filters role="role1">
                <Filter name="F1" active="true"/>
                <Filter name="F2" active="true"/>
                <Filter name="F3" active="false"/>
            </Filters>
            <InitialExpandDepth>2</InitialExpandDepth>
        </Expand>
    </DataLoader>
    <UIFunctions>
        <FilterChooser>true</FilterChooser>
        <ExpandAll>true</ExpandAll>
    </UIFunctions>
</Rows>-
The filters are defined within the Filters element and all the filters must be taken from the same role (unless XML filters are used).
-
The active flag is set to true/false within the filter directly, instead of having to duplicate these settings on the FilterSelector.
-
The FilterSelector element is deprecated. To enable the filter selector, use the "FilterChooser" element
-
The ExpandAll element requires a Boolean within the body text.
3. Structure Browser
3.2. Alternate OID / Alternate Type Expression
If the column applies to relationships, the alternate OID and type expressions will also be selected from the relationship.
3.3. Column Setting: Filter
The setting Filter can be used to define if a column should be available on the "column filter" dialog.
4. Report Generator
4.1. MQL Section
A convenient configuration element can be added to an advanced report definition in order to include XML output from a MQL command invocation.
This is illustrated below:
<AdvancedReport>
    <Definition>
        <MQLSection>
            <Description>...</Description>
            <XML>true</XML>
            <Code>temp webreport ... xml;</Code>
        </MQLSection>
    </Definition>
</AdvancedReport>
Many MQL commands can produce XML output, for example the "webreport" or "export" commands. The webreport is very useful in some cases when you need to do some calculation or data grouping.
Remember to set the <XML>true</XML> if you get XML output from the MQL
command.
5. ECO / ECR Manager
New configuration files that support the ENOVIA V6 data model have been added.
The commands that should be used in a V6 environment are:
-
TVCECOManagementV6
-
TVCECRManagementV6
6. Graphic Reporting
6.1. Predefined Charts
A new feature in the Graphic Reporting allows you to pre-define charts.
You can now define a chart with an xml file and create a command to launch it.
It needs data in the form of a table bean, and if it is launched in the context of a Structure Browser page it uses the table bean already created or if it is used without the Structure Browser a java class must be created to provide the table bean.